
Previous Story
Technical analysis of NZD/USD for June 27, 2017
Posted On 27 Jun 2017
Comment: 0
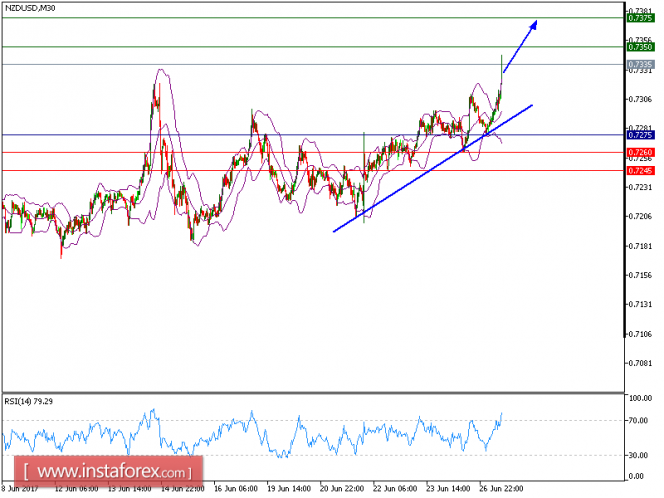
All our targets which we predicted yesterday of the NZD/USD pair have been hit. NZD/USD is still trading on upside and expected to follow the bullish bias above 0.7275. Although the pair broke below its 20-period and 50-period moving averages, a support base at 0.7275 has been formed and has allowed for a temporary stabilization. The relative strength index lacks downward momentum.
Hence, as long as 0.7275 holds on the downside, look for a further rise to 0.7350 and even to 0.7375 in extension.
Strategy: BUY Stop Loss: 0.7275. Take Profit: 0.7350
Chart Explanation: The black line shows the pivot point. Currently, the price is above the pivot point which indicates the bullish position. If it is below the pivot points, it indicates the short position. The red lines show the support levels and the green line indicates the resistance levels. These levels can be used to enter and exit trades.
Resistance levels: 0.7350, 0.7375, and 0.7405
Support levels: 0.7260, 0.7245, and 0.7300
The material has been provided by InstaForex Company – www.instaforex.com


