
Previous Story
Technical analysis of NZD/USD for March 21, 2017
Posted On 21 Mar 2017
Comment: 0
Overview:
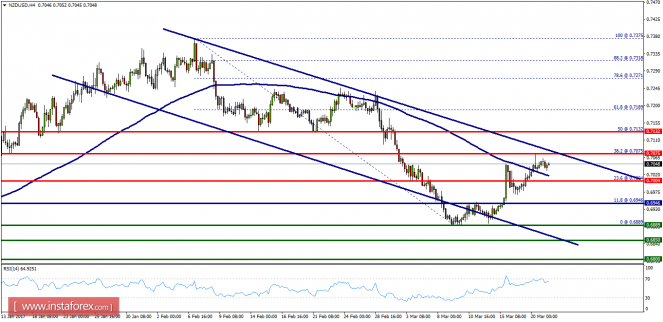
- The NZD/USD pair was trading around the area of 0.7075 Today, the level of 0.7075 represents the double top. The pair has already formed minor resistance at 0.7004 and the strong resistance is seen at the level of 0.7075 because it represents the weekly resistance 1. So, major resistance is seen at 0.7004, while immediate support is found at 0.6889. If the pair closes below the price of 0.6889, the NZD/USD pair may resume its movement to 0.6850 to test the daily support 2.
We expect the NZD/USD pair to move between the levels of 0.7004 and 0.6850. Equally important, the RSI is still calling for a strong bearish market. The current price is also below the moving average 100. As a result, sell below the double top of 0.7004 with targets at 0.6869 and 0.6850. On the other hand, stop loss should always be taken into account; accordingly, it will be good to set the stop loss above the last bullish wave at the level of 0.7075.
The material has been provided by InstaForex Company – www.instaforex.com


