
Previous Story
Technical analysis of NZD/USD for November 25, 2017
Posted On 27 Nov 2017
Comment: 0
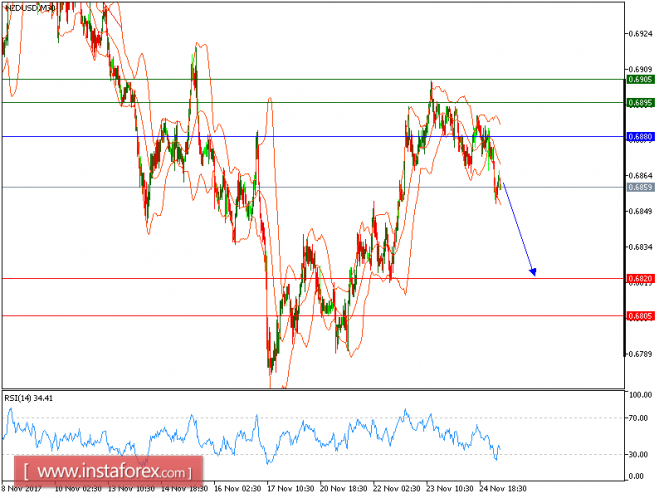
NZD/USD is expected to trade with bearish bias below 0.6880. The pair failed to break above its key resistance at 0.6880 and is now turning down. A bearish cross has been identified between the 20-period and 50-period moving averages, which should confirm a negative outlook. Last but not least, the relative strength index has broken below its neutrality area at 50.
In these perspectives, as long as 0.6880 holds on the upside, look for a new pullback to 0.6820 and 0.6805 in extension.
The black line shows the pivot point. Currently, the price is above the pivot point, which indicates long positions. If it remains below the pivot point, it will indicate short positions. The red lines are showing the support levels and the green line is indicating the resistance levels. These levels can be used to enter and exit trades.
Resistance levels: 0.6895, 0.6905, and 0.6950
Support levels: 0.6820, 0.6805, and 0.6770
The material has been provided by InstaForex Company – www.instaforex.com
Source:: Technical analysis of NZD/USD for November 25, 2017


