
Previous Story
Technical analysis of NZD/USD for November 30, 2017
Posted On 30 Nov 2017
Comment: 0
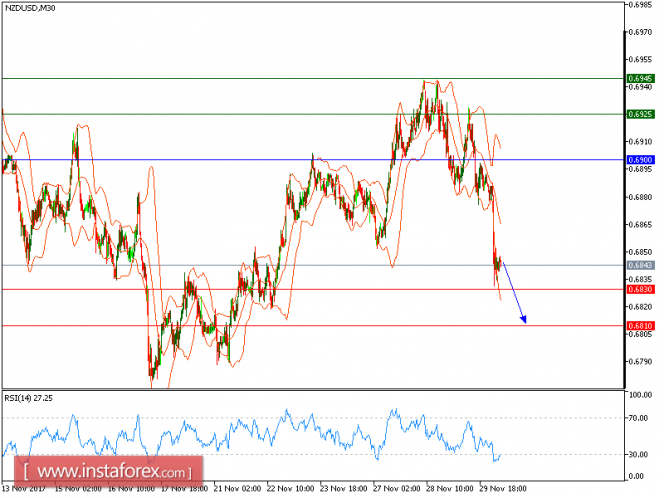
All our downside targets which we predicted in yesterday’s analysis have been hit. NZD/USD is expected to trade with a bearish outlook. The pair is accelerating on the downside this morning. The technical indicator such as the relative strength index is bearish and is now within its “oversold” area (below 30). The 20-period and 50-period moving averages are heading downward, which should confirm a negative outlook.
In which case, as long as 0.6900 is not surpassed, likely decline to 0.6830 and 0.6810 in extension.
The black line shows the pivot point. Currently, the price is above the pivot point, which indicates long positions. If it remains below the pivot point, it will indicate short positions. The red lines are showing the support levels and the green line is indicating the resistance levels. These levels can be used to enter and exit trades.
Resistance levels: 0.6925, 0.6945, and 0.6990
Support levels: 0.6830, 0.6810, and 0.6770
The material has been provided by InstaForex Company – www.instaforex.com
Source:: Technical analysis of NZD/USD for November 30, 2017


