
Previous Story
Technical analysis of NZD/USD for September 12, 2017
Posted On 12 Sep 2017
Comment: 0
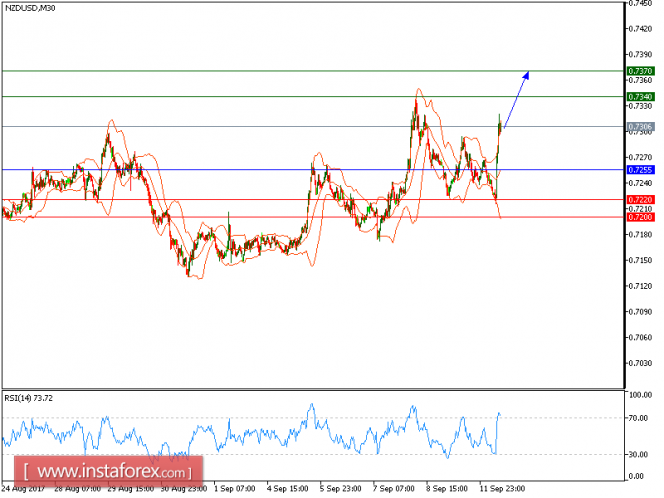
Our first downside target was hit in our previous analysis. Today NZD/USD is trading upward and expected to post some further advance. The pair posted a rebound from 0.7240 and broke above its 20-period and 50-period moving averages. The relative strength index is above its neutrality level at 50 and lacks downward momentum.
Hence, as long as 0.7255 is not broken, look for a further rebound to 0.7340 and even to 0.7370 in extension.
The black line shows the pivot point. Currently, the price is above the pivot point, which indicates the bullish position. If it remains below the pivot point, it will indicate the short position. The red lines show the support levels and the green line indicates the resistance levels. These levels can be used to enter and exit trades.
Resistance levels: 0.7340, 0.7370, and 0.7415
Support levels: 0.7220, 0.7200, and 0.7150
The material has been provided by InstaForex Company – www.instaforex.com
Source:: Technical analysis of NZD/USD for September 12, 2017


