
Previous Story
Technical analysis of NZD/USD for September 19, 2017
Posted On 19 Sep 2017
Comment: 0
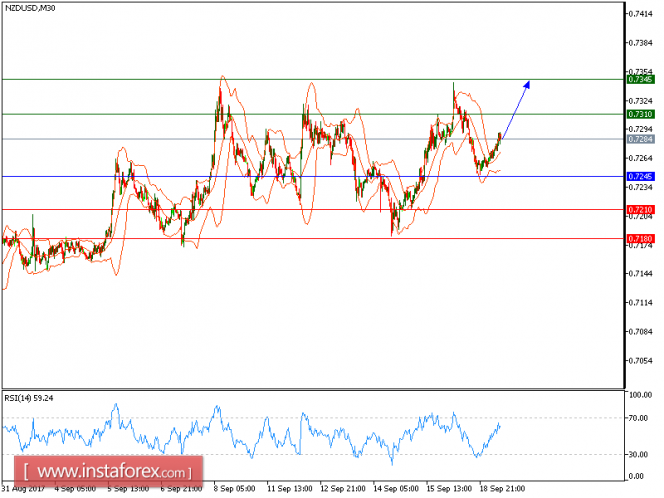
NZD/USD is expected to trade with a bullish outlook above the key support level of 0.7245. From a technical point of view, the relative strength index is bullish and is calling for further upside. In addition, the 20-period moving average on a 30-minute chart crossed above the 50-period moving average triggering a bullish signal.
As a consequence, long positions above 0.7245 with targets at 0.7310 and 0.7345 in extension can be considered.
The black line is showing the pivot point. Currently, the price is above the pivot point, which indicates long positions. If it remains below the pivot point, it will indicate short positions. The red lines is showing the support levels and the green line is indicating the resistance levels. These levels can be used to enter and exit trades.
Resistance levels: 0.7310, 0.7345, and 0.7380
Support levels: 0.7210, 0.7180, and 0.7150
The material has been provided by InstaForex Company – www.instaforex.com
Source:: Technical analysis of NZD/USD for September 19, 2017


