Previous Story
Technical Analysis of ETH/USD for July 27, 2020
Crypto Industry News:
Gas consumption and Ethereum fees are increasing every day. Although gas charges are not the highest ever (they were in 2018), they have risen sharply since mid-May. The gas charge is used to charge the costs to be brought to the network to execute a specific transaction, and as it increased, users paid higher transaction fees.
According to Wilson Withiam, a Messari researcher, Ethereum “was able to break its previous annual record of total gas consumption in domestic units.” This rising cost of gas had two-sided significance for Ethereum, namely on the one hand it meant an increase, and on the other hand it increased the network security budget, the researcher notes. Gas was recorded by ATH in 2018 – these charges are currently only 2,000 ETH lower and could set a new record.
Mining revenues have also risen sharply in the past two months, reaching an all-time high. According to data provided by Glassnode, miners’ toll revenues have reached a new peak. The hourly chart suggested that more than a third of ETH miners’ revenues came from fees rather than block subsidies. The + 25% sign is a good jump from less than 5% in April. Although miners’ fee income increased, this had a negative effect on the multiple of the FRM fee ratio.
FRM relates to blockchain security. Standing at the lower figure between 0 and 10, the FRM suggested that Ethereum could maintain its security budget (miners’ income) and not have to rely on an inflation subsidy. Currently, FRM has reached 21.51. In the near future, Ethereum will require high inflation through block award subsidies in order to maintain the current security budget.
Ethereum is stuck in a problem loop: the high price of gas, which also affects transaction fees. DeFi and Tether contributed to the growth of Ethereum – they contributed to user traffic on the network as the daily use of gas also reached an all-time high. However, the high fee scares off potential users, which is not a good sign for adoption.
Technical Market Outlook:
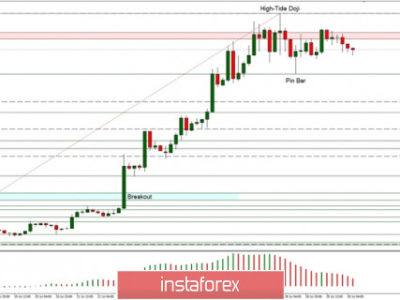
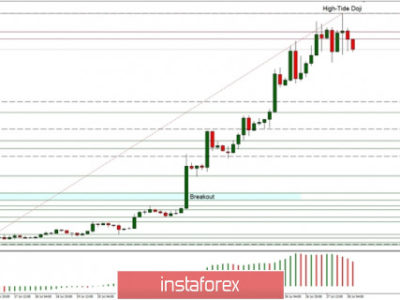
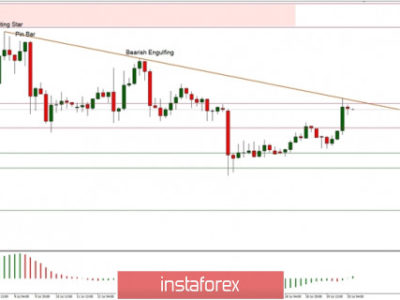
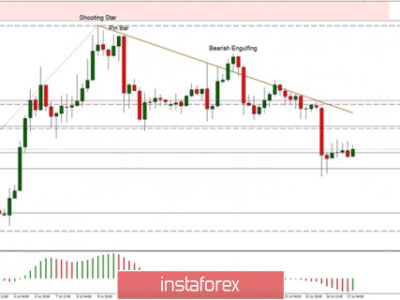
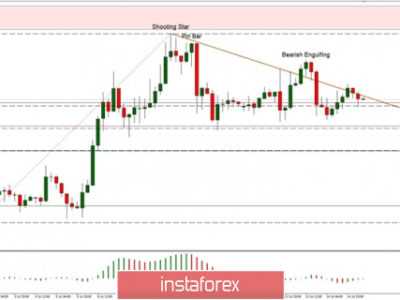
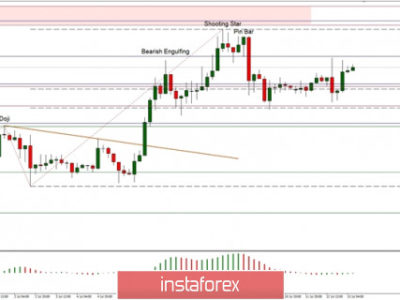
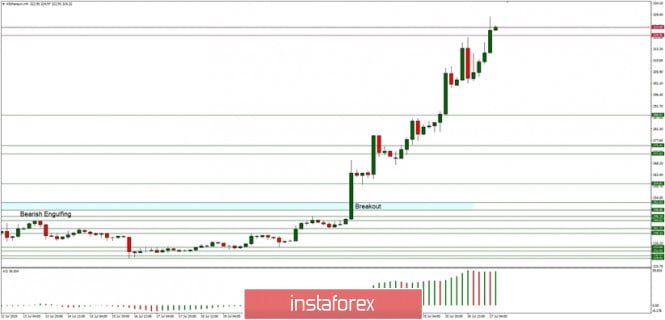
The ETH/USD pair has broken above the $300 level which was the key mid-term technical and psychological level for market participants. The recent swing high was made at the level of $328.70, but the bulls do not seem to stop just yet as the momentum is still strong and positive despite the overbought market conditions. The next target is seen at the level of $355 and the nearest technical support is located at the level of $320.92 and $300.00. There is only 4 days until the month’s end and the current monthly candle looks bullish.
Weekly Pivot Points:
WR3 – $435.28
WR2 – $378.51
WR1 – $351.41
Weekly Pivot – $292.40
WS1 – $265.43
WS2 – $206.30
WS3 – $178.38
Trading Recommendations:
The volatility on Ethereum is higher than usual, so all the dynamic moves up and down might reverse quickly. The larger time frame trend on Ethereum remains down and as long as the level of $365 is not violated, all rallies will be treated as a counter-trend corrective moves. This is why the short positions are now more preferred. The key long-term technical support is seen at the level of $174.82.
The material has been provided by InstaForex Company – www.instaforex.com