
Previous Story
Technical analysis of EUR/USD for August 07, 2019
Overview:
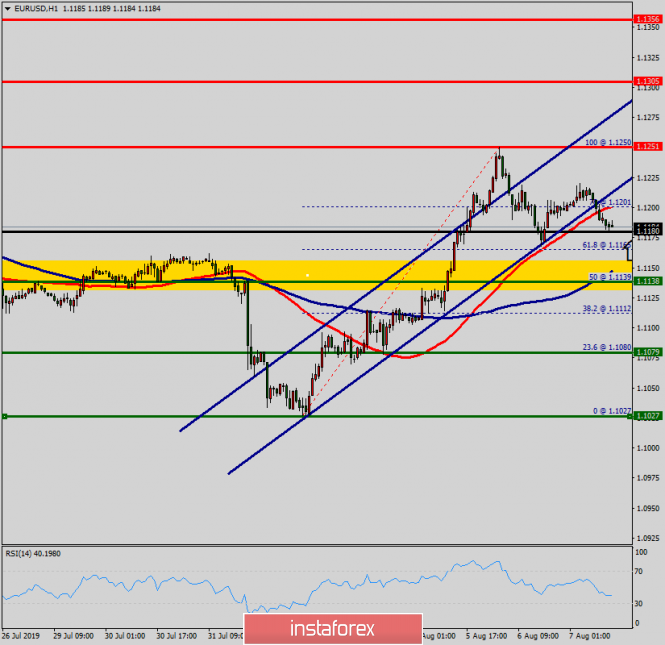
The bearish market of the EUR/USD pair turns to bullish market from the 50% of Fibonacci retracement levels (1.1139) towards the pivot point (1.1180). So, TheEUR/USD pair continues to move upwards from the level of 1.1139. Today, the first support level is currently seen at 1.1139, the price is moving in a bullish channel now. The trend is still above the 100 EMA for that the bullish outlook remains the same as long as the 100 EMA is headed to the upside. The market is still in an uptrend. We still prefer the bullish scenario from the spot of 1.1139.
As the chart shows below, since the trend is above the 50% Fibonacci retracement on the H1 chart, the market is still in an uptrend. Strong support will be formed at the level of 1.1139 providing a clear signal to buy with the targets seen at 1.1251. If the trend breaks the double top at 1.1251 (first resistance), the pair will move upwards continuing the development of the bullish trend to the level 1.1305 in order to test the daily resistance 2. At the same time frame, resistance is seen at the levels of 1.1251 and 1.1251. The stop loss should always be taken into account for that it will be reasonable to set your stop loss at the level of 1.1138 (below the support 1).
The daily standard pivot
- Resistance 3 : 1.1356
- Resistance 2 : 1.1305
- Resistance 1 : 1.1251
- Pivot point : 1.1180
- Support 1 : 1.1138
- Support 2 : 1.1079
- Support 3 : 1.1027
The material has been provided by InstaForex Company – www.instaforex.com


