
Previous Story
Technical analysis of EUR/USD for Feb 26, 2020
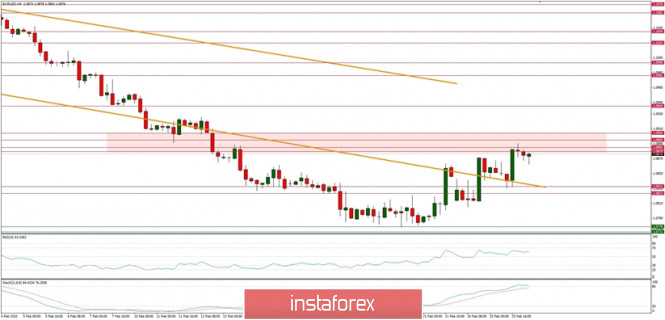
Technical Market Outlook:
The EUR/USD pair has hit the nearest short-term technical resistance zone located between the levels of 1.0879 – 1.0904, so now the price is back into the main descending channel ( marked as brown lines). Moreover, the price is out of the short-term channel for good (the black one), so now the bulls can make another wave up way more easier. The next target for bulls is seen at the level of 1.0895 – 1.0904 zones and the immediate support is seen at the level of 1.0772. The larger timeframe trend is still down.
Weekly Pivot Points:
WR3 – 1.0954
WR2 – 1.0908
WR1 – 1.0871
Weekly Pivot – 1.0825
WS1 – 1.0787
WS2 – 1.0735
WS3 – 1.0693
Trading recommendations:
The best strategy for current market conditions is the same as it was for recent months: trade with the larger timeframe trend, which is down. All upward moves will be treated as local corrections in the downtrend. The downtrend is valid as long as it is terminated or the level of 1.1445 clearly violated. There is an Ending Diagonal price pattern visible on the larger timeframes like weekly, which indicates a possible downtrend termination soon. The key short-term levels are technical support at the level of 1.0981 and the technical resistance at the level of 1.1267.
The material has been provided by InstaForex Company – www.instaforex.com


