
Previous Story
Technical analysis of EUR/USD for Feb 4, 2020
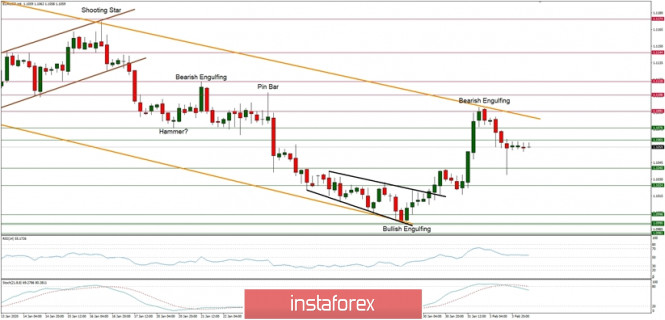
Technical Market Overview:
The EUR/USD pair has rallied towards the upper channel line located around the level of 1.1091 and reversed lower after the Bearish Engulfing candlestick pattern was made at the H4 timeframe chart. The market conditions are coming off the overbought levels and the momentum indicator barely holds above its fifty levels, so the bears are regaining the strength step by step. The price has tested the technical support located at the level of 1.2040 already, so more downside is expected in the near-term.
Weekly Pivot Points:
WR3 – 1.1243
WR2 – 1.1163
WR1 – 1.1138
Weekly Pivot – 1.1062
WS1 – 1.1035
WS2 – 1.0960
WS3 – 1.0930
Trading Recommendations:
The best strategy for current market conditions is the same as it was for recent months: trade with the larger timeframe trend, which is down. All upward moves will be treated as local corrections in the downtrend. The downtrend is valid as long as it is terminated or the level of 1.1445 clearly violated. There is an Ending Diagonal price pattern visible on the larger timeframes like weekly, which indicates a possible downtrend termination soon. The key short-term levels are technical support at the level of 1.0981 and the technical resistance at the level of 1.1267.
The material has been provided by InstaForex Company – www.instaforex.com


