
Previous Story
Technical analysis of EUR/USD for Mar 2, 2020
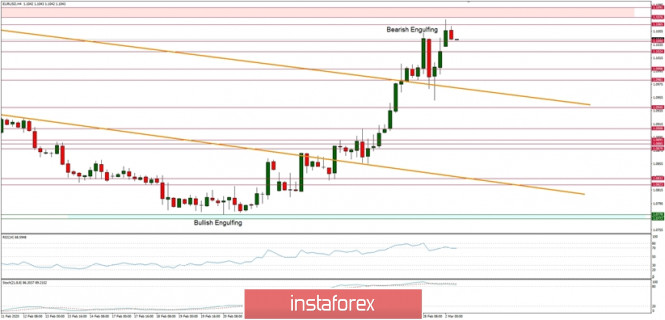
Technical Market Overview:
The EUR/USD pair has been rallying higher for the last week and the bulls have managed to hit the key short-term technical resistance located at the level of 1.1076. The Bearish Engulfing candlestick pattern made a few hours before the price has hit the resistance is an indication of decreasing momentum and a possible trend reversal, but to do it, the bears must break through the level of 1.0940 and get back to the main channel. The market conditions are now overbought despite the positive and strong momentum, so the downtrend might start to be continued any time soon.
Weekly Pivot Points:
WR3 – 1.1388
WR2 – 1.1223
WR1 – 1.1151
Weekly Pivot – 1.0973
WS1 – 1.0899
WS2 – 1.0724
WS3 – 1.0648
Trading Recommendations:
Despit the recent strong rally on EUR/USD the best strategy for current market conditions is the same as it was for last week: trade with the larger timeframe trend, which is down. All upward moves will be treated as local corrections in the downtrend. The downtrend is valid as long as it is terminated or the level of 1.1445 clearly violated. There is an Ending Diagonal price pattern visible on the larger timeframes like weekly, which indicates a possible downtrend termination soon. The key short-term levels are technical support at the level of 1.0778 and the technical resistance at the level of 1.1267.
The material has been provided by InstaForex Company – www.instaforex.com


