Previous Story
Technical analysis of GBP/USD for 01/02/2019
Technical analysis of GBP/USD for 01/02/2019:
Not much momentum left on the way up, another weakness indicators
Technical market overview:
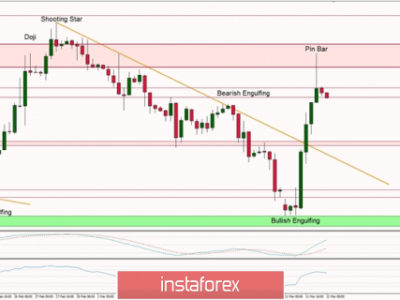
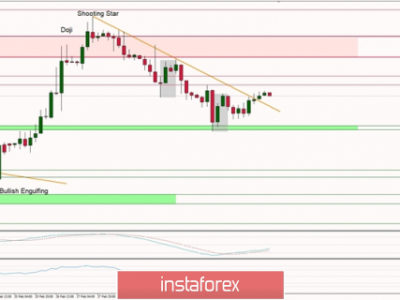
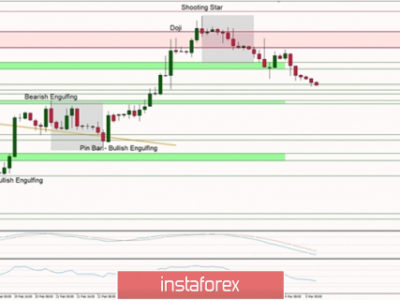
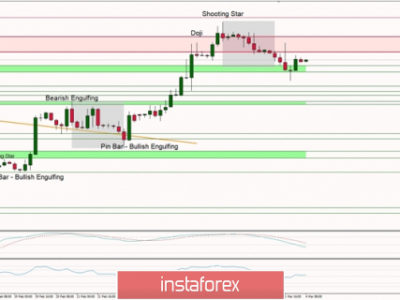
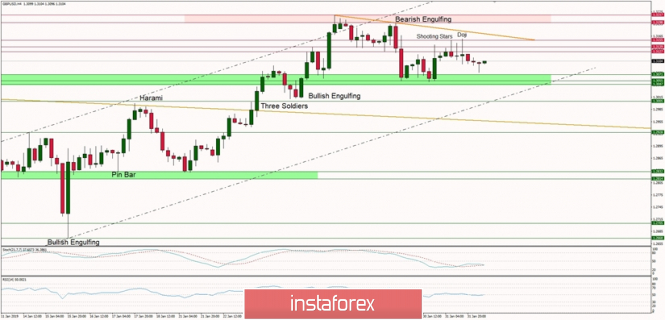
The GPB/USD pair is struggling to break out above the local resistance zone at the level of 1.3155 and the market has made a series of pin bars like candles in form of Shooting Star and Doji candlestick patterns. This indicates that another wave of weakness is coming to the market soon. Moreover, the price is trading below the local trend line resistance (marked in orange) which adds concern to the overall picture. On the other side, the market is still defending the technical support zone located between the levels of 1.3047 – 1.3071 and the price is trading inside of the channel zone. The technical resistance zone between the levels of 1.3047-1.3055 is the key technical support zone for bulls, so it is worth to keep an eye on this zone.
Weekly Pivot Points:
WR1 – 1.3382
Weekly Pivot – 1.3106
WS1 – 1.2995
WS2 – 1.2720
Trading recommendations:
All buyers should keep an eye on the current market developments as there are strong indications of a possible correction coming soon. The correction downward might accelerate once the key technical support zone is violated.
More aggressive traders with higher risk tolerance might enter the sell orders already with the protective SL above the level of 1.3155 and open target level for now ( below 1.3047 anyway).
The material has been provided by InstaForex Company – www.instaforex.com