
Previous Story
Technical analysis of GBP/USD for Feb 12, 2020
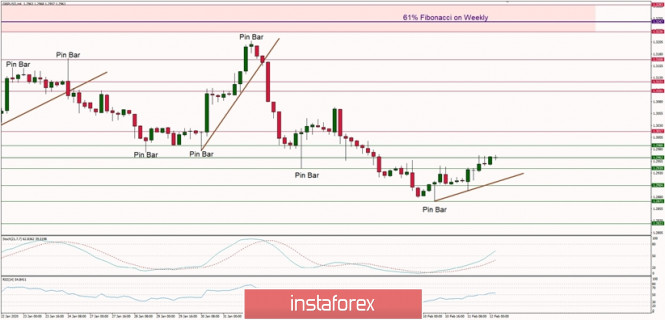
Technical Market Overview:
The GBP/USD pair has made a new low at the level of 1.2871 as anticipated, but this low was made on the Pin Bar candlestick pattern and the range breakout occurred in oversold market conditions. The breakout from the recent range might be the beginning of a larger correction to the downside and the next target for bears is seen at the level of 1.2823. In the meantime, the next technical resistance for the bouncing price is seen at the level of 1.2962 and it being tested currently.
Weekly Pivot Points:
WR3 – 1.3353
WR2 – 1.3269
WR1 – 1.3041
Weekly Pivot – 1.2956
WS1 – 1.2722
WS2 – 1.2624
WS3 – 1.2379
Trading Recommendations:
The best strategy for current market conditions is to trade with the larger timeframe trend, which is up, so all downward market moves will be treated as local corrections in the uptrend. In order to reverse the trend from up to down in the longer term, the key level for bulls is seen at 1.2756 and it must be clearly violated. The key long-term technical support is seen at the level of 1.2231 – 1.2224 and the key long-term technical resistance is located at the level of 1.3512.
The material has been provided by InstaForex Company – www.instaforex.com


