
Previous Story
Technical analysis of GBP/USD for Jan 21, 2020
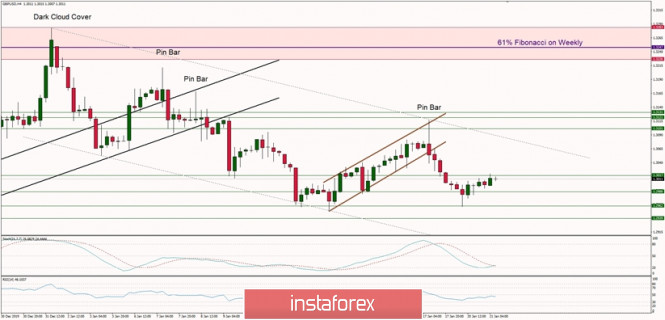
Technical Market Overview:
The GBP/USD pair has broken below the lower channel boundary located at the level of 1.3055 and the bears continued the move lower. After the channel breakout was done, the price fell to the level of 1.2988 which is a part of a demand zone located between the levels of 1.2939 – 1.3017 and then another lower low was made at the level of 1.2962. It looks like the downtrend is still continued as new lower lows are still being made, but currently, the local bounce form the level of 1.2962 has hit the technical resistance a the level of 1.3017 and market is trading sideways. Any violation of the level of 1.2939 will directly lead to the sell-off extension towards the level of 1.2904 and 1.2786. The weak and negative momentum supports the short-term bearish outlook.
Weekly Pivot Points:
WR3 – 1.3247
WR2 – 1.3172
WR1 – 1.3080
Weekly Pivot – 1.3013
WS1 – 1.2913
WS2 – 1.2847
WS3 – 1.2749
Trading recommendations:
The best strategy for current market conditions is to trade with the larger timeframe trend, which is up, so all downward market moves will be treated as local corrections in the uptrend. In order to reverse the trend from up to down in the longer term, the key level for bulls is seen at 1.2756 and it must be clearly violated. The key long-term technical support is seen at the level of 1.2231 – 1.2224 and the key long-term technical resistance is located at the level of 1.3509.
The material has been provided by InstaForex Company – www.instaforex.com


