
Previous Story
Technical analysis of GBP/USD for July 15, 2019
Overview:
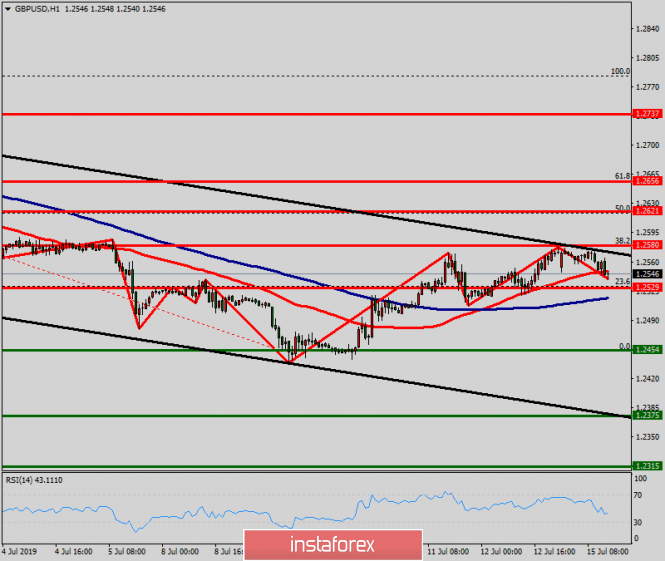
The GBP/USD pair continues to move downwards from the level of 1.2580. This week, the pair dropped from the level of 1.2580 to the bottom around 1.2454. But the pair rebounded from the bottom of 1.2454 then closed at 1.2560. Today, the first support level is seen at 1.2454, the price is moving in a bearish channel now. Furthermore, the price has been set below the strong resistance at the level of 1.2529, which coincides with the 23.6% Fibonacci retracement level. This resistance has been rejected several times confirming the veracity of a downtrend. Additionally, the RSI starts signaling a downward trend. As a result, if the NZD/USD pair is able to break out the first support at 1.2454, the market will decline further to 1.2375 in order to test the weekly support 2. Consequently, the market is likely to show signs of a bearish trend. So, it will be good to sell below the level of 1.2454 with the first target at 1.2375 and further to 1.2315. However, stop loss is to be placed above the level of 1.2580.
The material has been provided by InstaForex Company – www.instaforex.com


