
Previous Story
Technical Analysis of GBP/USD for July 21, 2020
Technical Market Outlook:
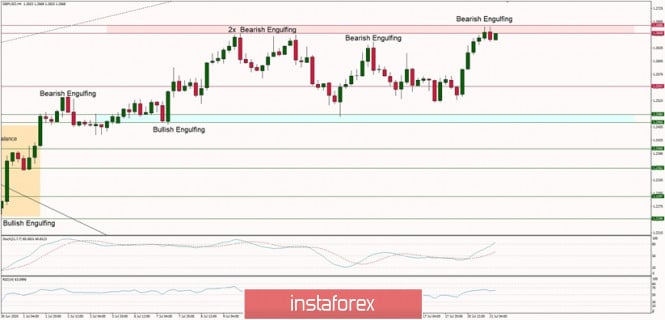
The GBP/USD pair has tested the key short-term supply zone located between the levels of 1.2668 – 1.2686, but the Bearish Engulfing pattern had been made at the H4 time frame chart. The volatility has decreased and the momentum is just slightly above the level of fifty. Only a sustained breakout above of below certain level can provide a clue regarding the next market move: supply zone seen between 1.2668 – 1.2686 or demand zone seen between the levels of 1.2466- 1.2484.
Weekly Pivot Points:
WR3 – 1.2834
WR2 – 1.2735
WR1 – 1.2648
Weekly Pivot – 1.2555
WS1 – 1.2463
WS2 – 1.2373
WS3 – 1.2271
Trading Recommendations:
On the GBP/USD pair the main trend is down, which can be confirmed by the down candles on the weekly time frame chart. The key long-term technical support has been recently violated (1.1983) and the new one is seen at the level of 1.1404. The key long-term technical resistance is seen at the level of 1.3518. Only if one of these levels is clearly violated, the main trend might reverse (1.3518) or accelerate (1.1404). The market might have done a Double Top pattern at the level of 1.2645, so the price might move even lower in the longer-term.
The material has been provided by InstaForex Company – www.instaforex.com


