
Previous Story
Technical analysis of the EUR/USD pair for the week of May 18-23, 2020
Trend analysis:
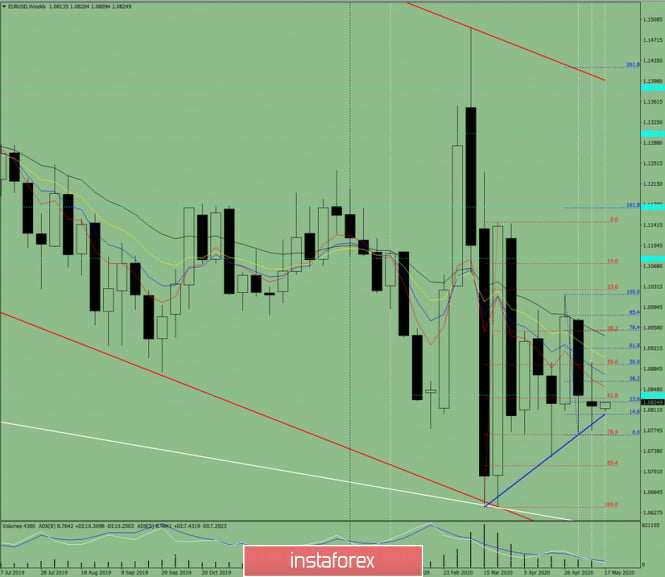
This week, the price from the level of 1.0818 (closing of the last weekly candlestick) can start to move up with the first target at 1.0862 – a pullback level of 38.2% (blue dashed line). After breaking through this level, the price will continue to move up to the next upper target at 1.0892 – a pullback level of 50.0% (blue dashed line).
Fig. 1 (weekly schedule).
Comprehensive analysis:
– indicator analysis – up;
– Fibonacci levels – up;
– volumes – up;
– candlestick analysis – neutral;
– trend analysis – up;
– Bollinger Lines – down;
– monthly chart – up.
The conclusion of a comprehensive analysis is an upward movement.
The overall result of calculating the candle of the EUR/USD currency pair according to the weekly chart: the price of the week is likely to have an upward trend with the absence of a lower shadow for the weekly white candlestick (Monday – up) and the presence of a second upper shadow (Friday – down).
The upper weekly target is 1.0921 – a pullback evel of 61.8% (blue dashed line).
An unlikely lower scenario: working down with the target at 1.0711 – a pullback level of 85.4% (red dashed line) from the support line 1.0803 (blue bold line).
The material has been provided by InstaForex Company – www.instaforex.com
Source:: Technical analysis of the EUR/USD pair for the week of May 18-23


