Previous Story
Technical analysis of USD/CAD for April 19, 2019
Overview:
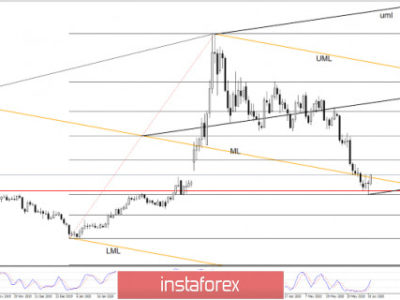
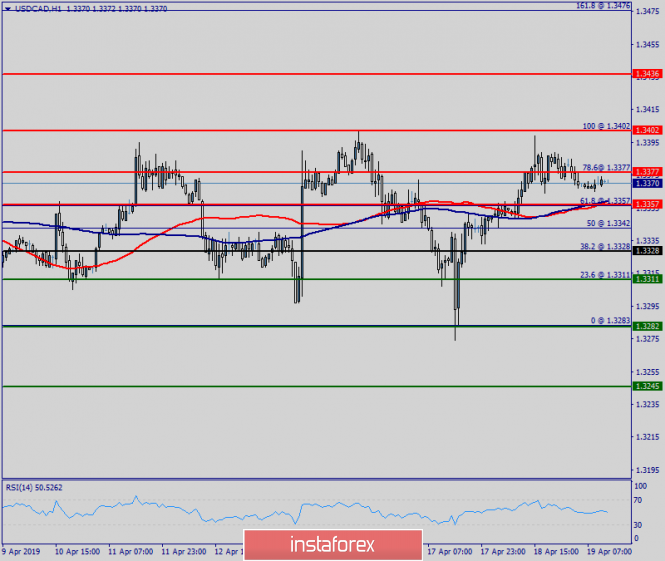
The USD/CAD pair continues to move upwards from the level of 1.3228. Yesterday, the pair rose from the level of 1.3228 (the level of 1.3228 coincides with a ratio of 38.2% Fibonacci retracement) to a top around 1.3357. Today, the first support level is seen at 1.3228 followed by 1.3311, while daily resistance 1 is seen at 1.3377. According to the previous events, the USD/CAD pair is still moving between the levels of 1.3228 and 1.3402; for that we expect a range of 174 pips (1.3402 – 1.3228). On the one-hour chart, immediate resistance is seen at 1.3357, which coincides with the double top. Currently, the price is moving in a bullish channel. This is confirmed by the RSI indicator signaling that we are still in a bullish trending market. The price is still above the moving average (100), Therefore, if the trend is able to break out through the first resistance level of 1.3357, we should see the pair climbing towards the daily resistance at the levels of 1.3377 and 1.3402. It would also be wise to consider where to place stop loss; this should be set below the second support of 1.3282.
The material has been provided by InstaForex Company – www.instaforex.com