
Previous Story
Technical analysis of weekly chart on EUR/USD
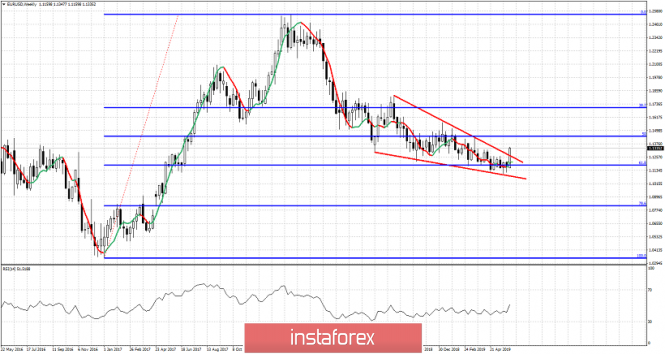
EURUSD as we mentioned in previous posts, has most probably made an important long-term bottom around 1.11 and has reversed to the upside. Having broken out of bearish channels, EURUSD pulled back during the week confirming the support at 1.12 and since then has resumed the up trend reversal to end the week near its highest levels.
Red lines – wedge pattern
EURUSD has broken the wedge pattern to the upside after bottoming at the important Fibonacci retracement level of 61.8%. EURUSD has broken above recent highs at 1.1260 and is now trading above 1.13. Trend is bullish. Price continues to make higher highs and higher lows and over the next few weeks I expect EURUSD to move towards 1.17. As long as price is above 1.12, any pull back will be seen as a buying opportunity for a move at least towards 1.17. We are now bullish EURUSD.
The material has been provided by InstaForex Company – www.instaforex.com


