Previous Story
Technical Analysis on SP500 and WTI Crude [Video]
Weekly Bonus Analysis Video: S&P500 and WTI Crude (4 min)
TEXT:
Hello everybody ..welcome to our Weekly Bonus Analysis Video ..I’m Stef Breschi and today is Saturday 19th September 2015. Today we’ll be analyzing again the SP500 and WTI Crude.
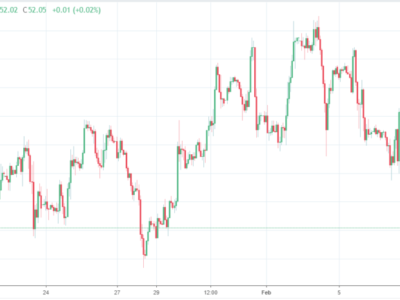
S&P500Last week we anticipated price would trade inside a box range 1900-1990 and we can see that during the week price tried to break to the upside but failed.
2000 now has to be seen as significant resistance and we have now widened the trading range to 1900-2000. The last 2 bearish candles point at further short term weakness to come. Next week traders should be looking to go Short on any retracement of Friday’s candle with a view for price to re-test 1900 and possibly below.
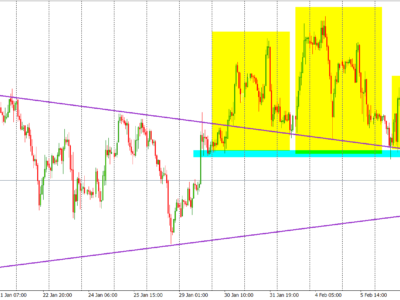
WTI CRUDE(Weekly)
Interesting picture shown by the weekly chart. Price stuck at 45$ level which acted as strong support end of 2014 and beginning of 2015. Then market broke through it and is now meeting with resistance just above it. This dynamic can mean further downside to come.
(Daily)
The daily chart shows how price seems to be trading in a triangular pattern and within it attempted to break above the 50 sma and the 38.2 Fib level but failed. So next week we should see a re-test of the bottom of this consolidation pattern around 43$ which we will be watching closely as a key level.
Thank you for watching .. please take a look at our subscription service STTS (Short Term Trade Setups) which covers also gold and the major currencies and includes entry levels, stops and targets combined with our tried and tested risk management strategy
Come and find us on tff-onlinetrading/market analysis
Have a great week!
DISCLAIMER
The information contained in this publication is not intended as an offer or solicitation for the purchase or sale of any financial instrument. Users acknowledge and agree to the fact that, by its very nature, any investment in CFDs and similar and assimilated products is characterised by a certain degree of uncertainty and that, consequently, any investment of this nature involves risks for which the user is solely responsible and liable.
Any recommendation, opinion or advice contained in such material reflects the views of TFF, and TFF expressly disclaims any responsibility for any decisions or for the suitability of any security or transaction based on it. Specifically, any decisions you may make to buy, sell or hold a security based on such research will be entirely your own and not in any way deemed to be endorsed or influenced by or attributed to TFF.
Past performance should not be seen as an indication of future performance. Market and exchange rate movements may cause the value of your investment to rise or fall and an investor may not get back the amount invested.
Eligibility for participation in the capital pool is subject to final determination and acceptance by TFF.
Investments are not obligations of, deposits in, insured or guaranteed by TFF.