
Previous Story
Technical analysis recommendations for the EUR/USD and GBP/USD on Nov 19, 2019
Economic calendar (Universal time)
Today, the economic calendar does not shine with important indicators again. Thus, you can only pay attention to statistics from the United States at 13:30, led by data on the number of construction permits issued.
EUR / USD
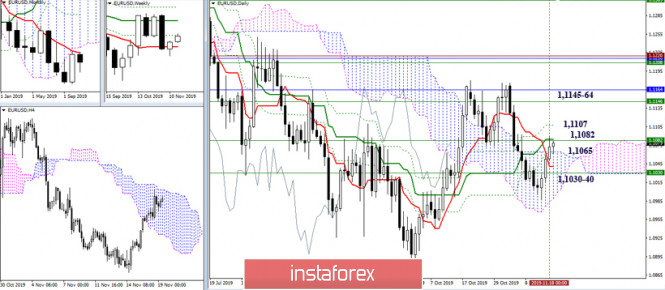
Yesterday, the pair continued to rise and tested the important level of 1.1082 (weekly Fibo Kijun + day Kijun) for strength, indicating breaking in the lower halves. Overcoming these resistances and eliminating the daily dead cross of Ichimoku (1.1107 final level) will allow players to raise new plans and consider the following important prospects, for example, conquering the weekly medium-term trend (1.1145) and the monthly short-term trend (1.1164). The attraction in the current situation is provided by the upper border of the daily cloud (1.1065), and today, significant support is concentrated in the area of 1.1030-40 (daily Tenkan + weekly Tenkan).
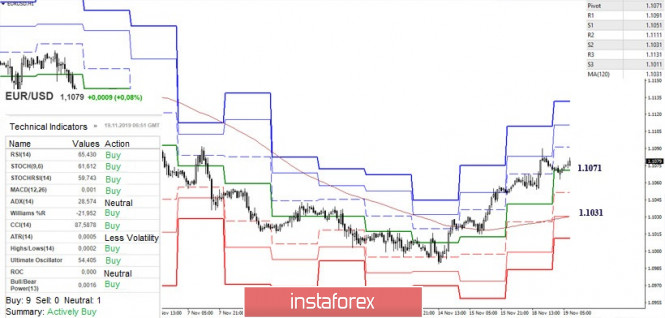
In the lower halves, the technical advantage is now on the side of players to increase. Despite the correction, the bulls retain the key support. The resistance lines of the classic pivot levels, which are located at 1.1091 (R1) – 1.1111 (R2) – 1.1131 (R3) today, are the upward reference points within the day. A change in the balance of forces may begin after the loss of support for the central pivot level 1.1071, then strengthening bearish sentiment will be interested in overcoming the weekly long-term trend, which is now at 1.1031. Meanwhile, intermediate support may be provided by 1.1051 (S1).
GBP / USD
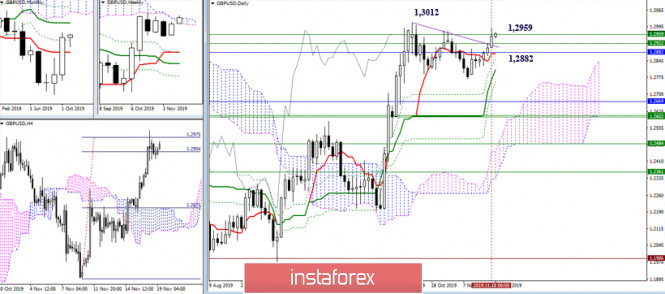
The pair fulfilled the target for the breakdown of the H4 cloud and continues to struggle with the resistance of the weekly cloud. Significant boundaries are now at 1.2959 (the upper border of the cloud) and 1.3012 (maximum correction extreme). The weekly cloud in this place is the narrowest, which enhances the ability to overcome it. The resistance zone (1.2959 – 1.2922 – 1.2882), with which a confrontation has been going on for a long time, continues to exert attraction. A return to the daily short-term trend (1.2882 area) will change the current distribution of forces and return bearish prospects.
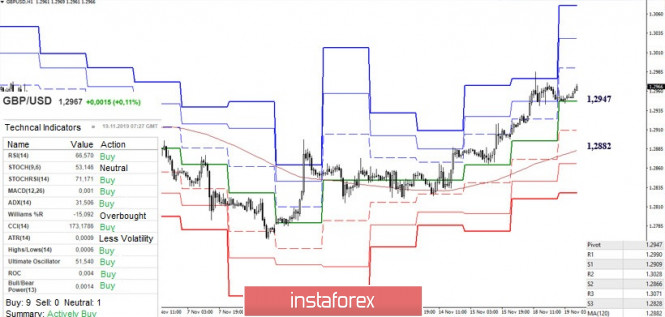
Support for the analyzed technical instruments on H1 belongs entirely to the players on the rise. A weakening factor is being in the correction zone. If you exit the correction zone, reference points within the day will be the resistance of the classic pivot levels 1.2990 (R1) – 1.3028 (R2) – 1.3071 (R3). The loss of support for the central pivot level (1.2947) will begin to change the current balance of forces, making the weekly long-term trend (1.2882) the main bearish guideline, which is now strengthened by significant support for the higher halves. Thus, consolidation below will be important and it will be better to re-evaluate the situation in the place.
Ichimoku Kinko Hyo (9.26.52), Pivot Points (classic), Moving Average (120)
The material has been provided by InstaForex Company – www.instaforex.com
Source:: Technical analysis recommendations for the EUR/USD and GBP/USD on November 19


