
Previous Story
Technical analysis of USD/CHF for February 15, 2018
Posted On 15 Feb 2018
Comment: 0
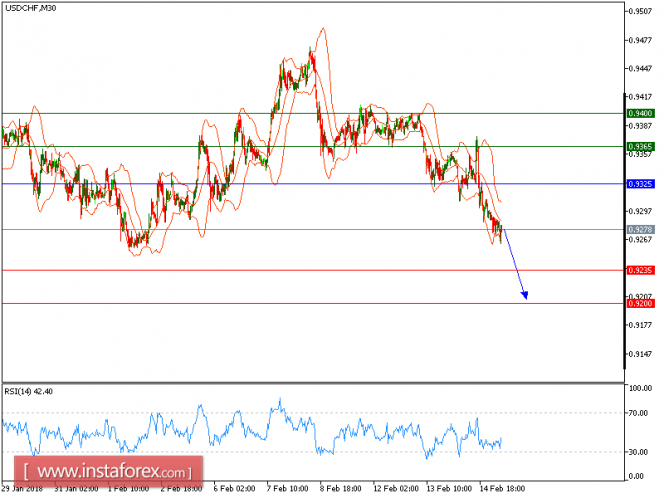
All our downside targets which we predicted in the yesterday’s analysis have been hit. USD/CHF is expected to continue the downside movement. The pair is under pressure below the key resistance at 0.9325, which should limit the upside potential. Both declining 20-period and 50-period moving averages should push the prices lower. The relative strength index lacks upward momentum.
Hence, as long as 0.9325 holds on the upside, look for a new drop with targets at 0.9235 and 0.9200 in extension.
Chart Explanation: The black line shows the pivot point. The present price above the pivot point indicates a bullish position, and the price below the pivot point indicates a short position. The red lines show the support levels, and the green line indicates the resistance levels. These levels can be used to enter and exit trades.
Strategy: SELL, stop loss at 0.9325, take profit at 0.9235.
Resistance levels: 0.9365, 0.9400, and 0.9440
Support levels: 0.9235, 0.9200, and 0.9160.
The material has been provided by InstaForex Company – www.instaforex.com
Source:: Technical analysis of USD/CHF for February 15, 2018


