
Previous Story
Technical analysis of USD/CHF for February 23, 2018
Posted On 23 Feb 2018
Comment: 0
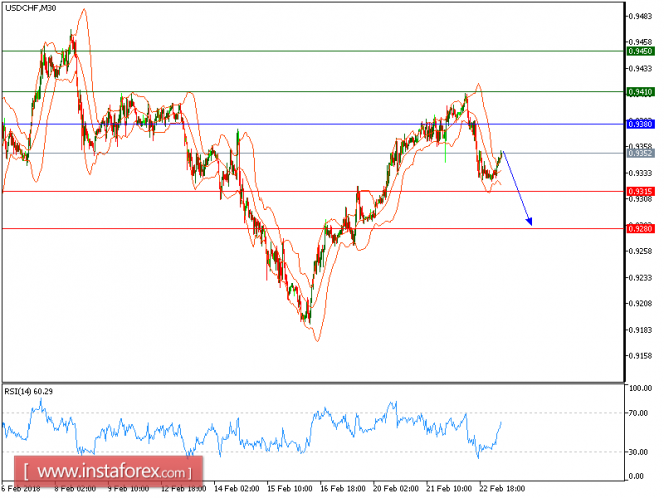
USD/CHF is turning down. The pair retreated from 0.9410 (the high of February 22). The 20-period moving average crossed below the 50-period one. The relative strength index shows downside momentum.
Hence, as long as 0.9380 holds on the upside, look for further drop to 0.9315 and even to 0.9280 in extension.
Chart Explanation: The black line shows the pivot point. The present price above the pivot point indicates a bullish position, and the price below the pivot point indicates a short position. The red lines show the support levels, and the green line indicates the resistance levels. These levels can be used to enter and exit trades.
Strategy: SELL, stop loss at 0.9380, take profit at 0.9315.
Resistance levels: 0.9410, 0.9450, and 0.9485
Support levels: 0.9315, 0.9280, and 0.9250.
The material has been provided by InstaForex Company – www.instaforex.com
Source:: Technical analysis of USD/CHF for February 23, 2018


