
Previous Story
Technical analysis of USD/CHF for January 02, 2018
Posted On 02 Jan 2018
Comment: 0
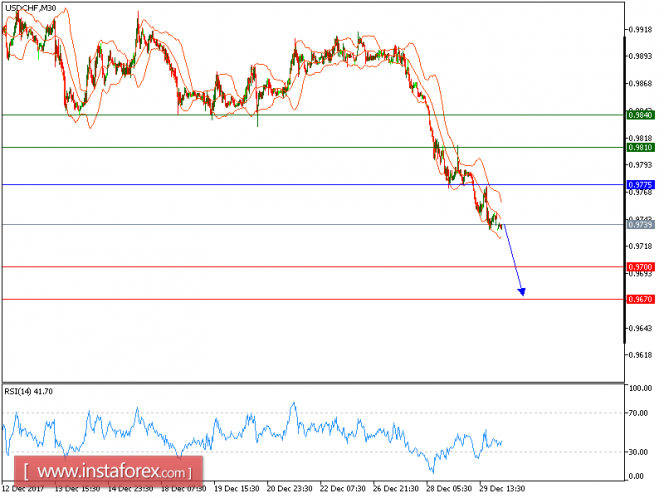
Our targets which we predicted in yesterday’s analysis have been hit. The pair failed to break above its horizontal level at 0.97750, and is now under pressure. The process of lower highs and lows remains intact, which should confirm a negative outlook. In addition, the relative strength index is heading downward.
In which case, as long as 0.9775 is not surpassed, expect a new pullback to 0.9730 at first. A break below 0.9730 would trigger a drop towards 0.9700.
Chart Explanation: The black line shows the pivot point. The present price above the pivot point indicates a bullish position, and the price below the pivot points indicates a short position. The red lines show the support levels and the green line indicates the resistance levels. These levels can be used to enter and exit trades.
Strategy: SELL, Stop Loss: 0.9775, Take Profit: 0.9700
Resistance levels: 0.9810, 0.9840, and 0.9860
Support levels: 0.9700, 0.9670, and 0.9650
The material has been provided by InstaForex Company – www.instaforex.com


