
Previous Story
Technical analysis of USD/CHF for January 22, 2018
Posted On 22 Jan 2018
Comment: 0
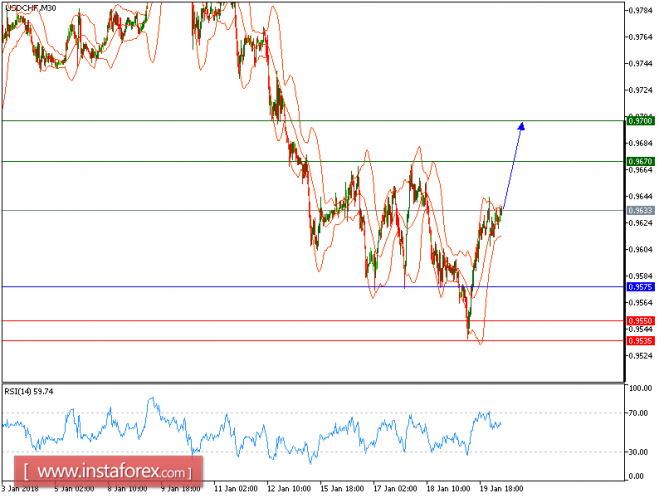
USD/CHF is expected to continue its rebound and expected to further advance. The pair is now in a bullish trend after the recent upside breakout of its declining trend line. The 20-period moving average reversed up, and also crossed above the 50-period one. Last but not least, the relative strength index stays above its neutrality area at 50, without showing any strong reversal signal.
To conclude, as long as 0.9575 is not broken, look for a new rise to 0.9670 and 0.9700 in extension.
Chart Explanation: The black line shows the pivot point. The present price above the pivot point indicates a bullish position, and the price below the pivot point indicates a short position. The red lines show the support levels and the green line indicates the resistance levels. These levels can be used to enter and exit trades.
Strategy: BUY, stop loss at 0.9575, take profit at 0.9670.
Resistance levels: 0.9670, 0.9700, and 0.9740
Support levels: 0.9550, 0.9535, and 0.9490.
The material has been provided by InstaForex Company – www.instaforex.com


