
Previous Story
Technical analysis of USD/JPY for February 2, 2018
Posted On 02 Feb 2018
Comment: 0
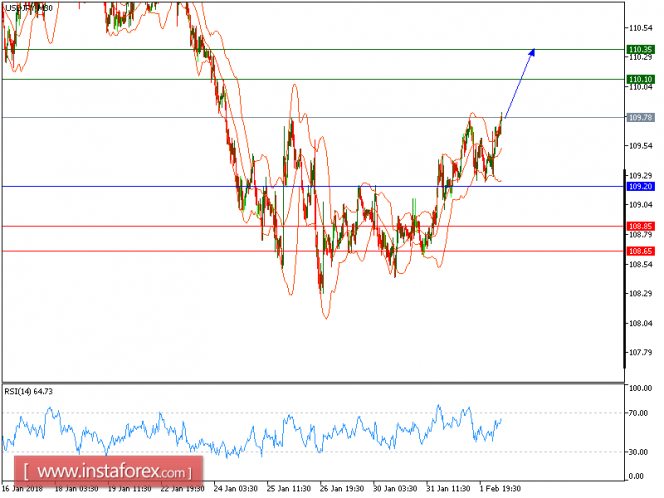
Our first upside target which we predicted in the previous analysis has been hit. USD/JPY is expected to trade with a Bullish bias above 109.20. Despite the recent pullback from 109.75 (the high of February 1), a support base at 109.20 has formed and has allowed for a temporary stabilization. The relative strength index lacks downward momentum.
The U.S. dollar saw its downtrend resume despite rising Treasury yields, as investors focused on the eurozone’s economic strength.
Therefore, as long as 109.20 is not broken, look for a further upside with targets at 110.10 and 110.35 in extension.
Alternatively, if the price moves in the opposite direction, a Short position is recommended to be below 109.20 with a target of 108.85.
Chart Explanation: The black line shows the pivot point. The current price above the pivot point indicates a bullish position, while the price below the pivot point is a signal for a short position. The red lines show the support levels, and the green line indicates the resistance level. These levels can be used to enter and exit trades.
Strategy: BUY, stop loss at 109.20, take profit at 110.10.
Resistance levels: 110.10, 110.35, and 110.65
Support levels: 108.85, 108.65, and 108.30.
The material has been provided by InstaForex Company – www.instaforex.com


