
Previous Story
Technical analysis of USD/JPY for February 21, 2018
Posted On 21 Feb 2018
Comment: 0
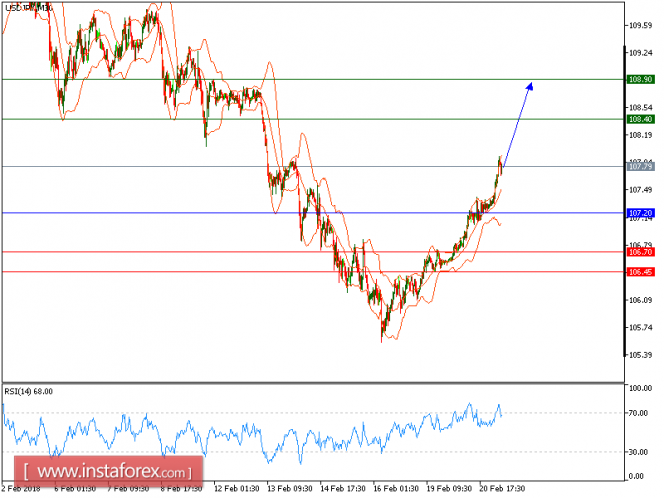
All our upside targets which we predicted in the yesterday’s analysis have been hit. The pair is still expected to continue its upside movement. The pair is charging higher while being supported by the ascending 20-period moving average. The rising trend line drawn from the low of last Friday (February 16) remains intact. Strong intraday bullishness is still maintained by those well-directed 20-period and 50-period moving averages. The overhead resistance is located at 108.40, followed by 108.90.
Alternatively, if the price moves in the opposite direction, a short position is recommended to be below 107.20 with a target of 106.70.
Chart Explanation: The black line shows the pivot point. The current price above the pivot point indicates a bullish position, while the price below the pivot point is a signal for a short position. The red lines show the support levels, and the green line indicates the resistance level. These levels can be used to enter and exit trades.
Strategy: BUY, stop loss at 107.20, take profit at 108.40.
Resistance levels: 108.40, 108.90, and 109.15
Support levels: 106.70, 106.45, and 106.00.
The material has been provided by InstaForex Company – www.instaforex.com
Source:: Technical analysis of USD/JPY for February 21, 2018


