
Previous Story
Technical analysis of USD/JPY for January 02, 2017
Posted On 02 Jan 2018
Comment: 0
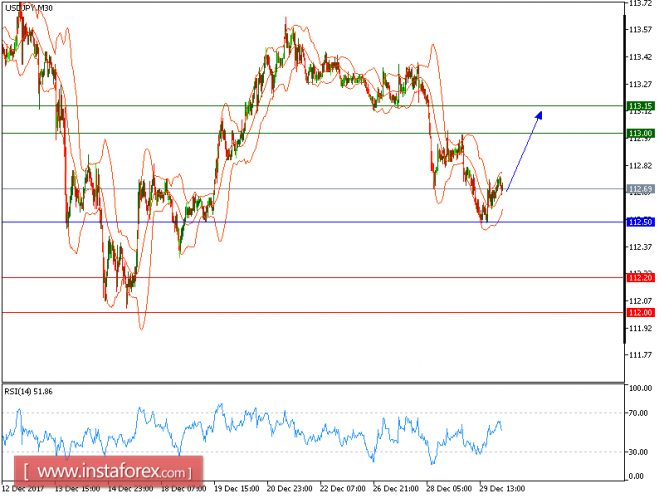
USD/JPY is expected to trade with a bullish outlook. The pair posted a rebound from 112.45 and broke above its 20-period and 50-period moving averages. The relative strength index calls for a new upleg.
The U.S. dollar remained under pressure last Friday, with the ICE Dollar Index losing another 0.5% to 92.12, its lowest close since September. For the whole year of 2014, the Dollar Index shed 9.9%, its worst performance since 2003 when it lost 14.6%.
To conclude, as long as 112.50 is not broken, a further advance to 113.00 and even to 113.15 seems more likely to occur.
Alternatively, if the price moves in the opposite direction, a short position is recommended below 112.50 with a target of 112.20.
Chart Explanation: The black line shows the pivot point. The current price above the pivot point indicates a bullish position, while the price below the pivot point is a signal for a short position. The red lines show the support levels and the green line indicates the resistance level. These levels can be used to enter and exit trades.
Strategy: SELL, Stop Loss: 112.50, Take Profit: 113.00
Resistance levels: 113.00, 113.15 and 113.35 Support Levels: 112.20, 112.00, 111.70
The material has been provided by InstaForex Company – www.instaforex.com


