
Previous Story
Technical analysis of USD/CHF for August 18, 2017
Posted On 18 Aug 2017
Comment: 0
Overview:
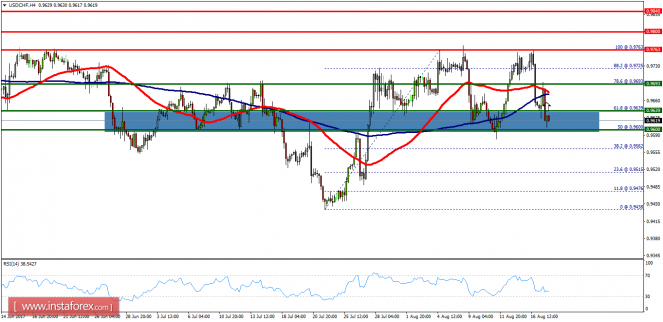
- The USD/CHF pair continues moving upwards from the spot 0.9639. The bias remains bullish in the nearest term testing 0.9763 or 0.9800.
- The market has been trading around the area of 0.9639/0.9600 this week. The pair rose from the levels of 0.9639 and 0.9600 (the level of 0.9639 and 0.9600 coincide with the ratios of 61.8% Fibonacci retracement and 50%) to a top around 0.9733.
- The first support level is seen at 0.9639 followed by 0.9600, while daily resistance 1 is seen at 0.9763.
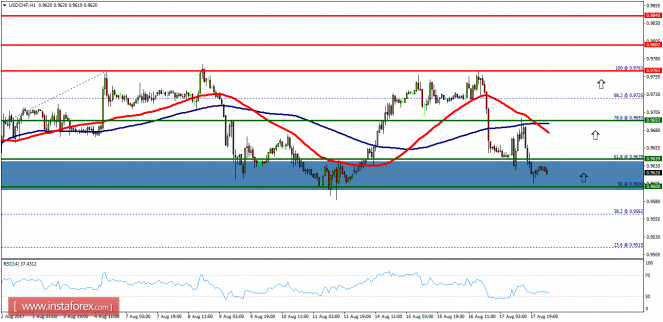
The USD/CHF pair is still moving between the levels of 0.9693 and 0.9763 in coming hours. On the one-hour chart, immediate resistance is seen at 0.9763 which coincides with the double top. - Currently, the price is moving in a bullish channel. This is confirmed by the RSI indicator signaling that we are still in a bullish trending market.
- The price is still above the moving average (100).
Therefore, if the trend is able to break out through the first resistance level of 0.9763, we should see the pair climbing towards the second daily resistance at 0.9800 to test it. However, it would also be wise to consider where to place stop loss; this should be set below the last support 0.9600. The trend is still calling for a strong bullish market as long as the trend is still above the level of 0.9600.
The material has been provided by InstaForex Company – www.instaforex.com


