
Previous Story
Technical analysis of USD/CHF for August 18, 2017
Posted On 18 Aug 2017
Comment: 0
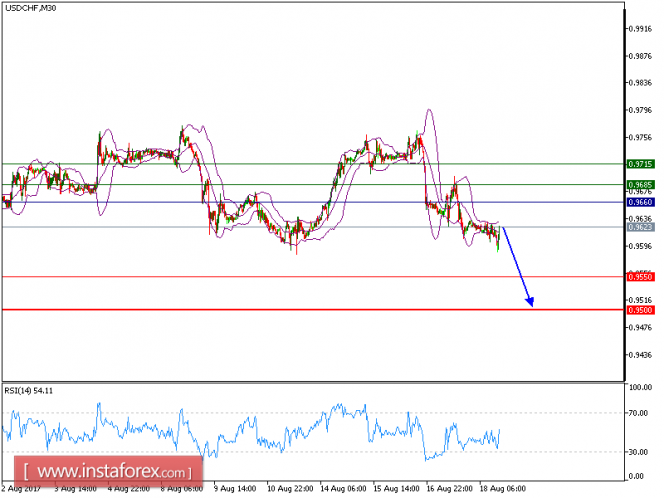
USD/CHF is expected to continue the downside movement. The pair is trading below its declining 20-period and 50-period moving averages, which play resistance roles and maintain the downside bias. The relative strength index is bearish below its neutrality level at 50.
To conclude, as long as 0.9660 is resistance, a further downside to 0.9550 and even to 0.9500 seems more likely to occur.
Chart Explanation: The black line shows the pivot point. The present price above the pivot point indicates the bullish position, and the price below the pivot points indicates the short position. The red lines show the support levels and the green line indicates the resistance levels. These levels can be used to enter and exit trades.
Strategy: SELL, Stop Loss: 0.9660, Take Profit: 0.9550
Resistance levels: 0.9685, 0.9715, and 0.9750
Support levels: 0.9550, 0.9500, and 0.9475
The material has been provided by InstaForex Company – www.instaforex.com


