
Previous Story
Technical analysis of USD/CHF for June 26, 2017
Posted On 26 Jun 2017
Comment: 0
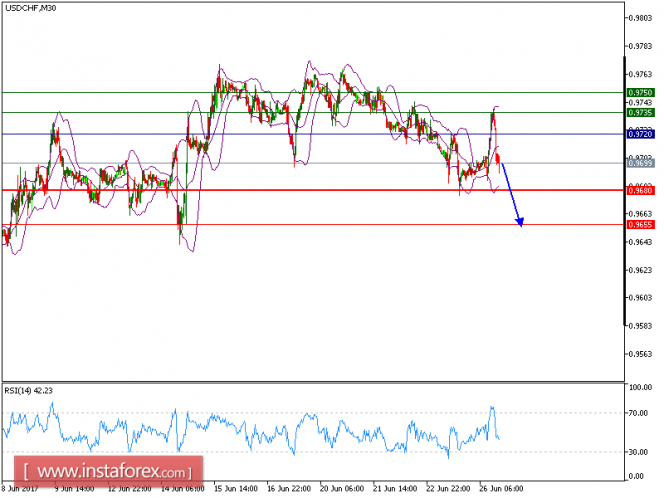
USD/CHF is turning down and expected to trade in lower range. The pair is also capped by the declining trend line since June 20, which confirms a negative outlook. The declining 20-period and 50-period moving averages play resistance roles and maintain the downside bias. The relative strength index is below its neutrality level at 50.
The US dollar weakened against other major currencies as investors doubted whether the Federal Reserve would raise interest rates again this year in face of softening inflation data. St. Louis Fed President James Bullard said that the Fed could take a break from raising rates. “Recent inflation data have surprised to the downside and call into question the idea that U.S. inflation is reliably returning toward target, the FOMC can wait and see how key macroeconomic developments play out in the quarters ahead,” he said.
To conclude, as long as 0.9720 holds on the upside, a further drop to 0.9680 and even to 0.9655 seems more likely to occur.
Graph Explanation: The black line shows the pivot point, present price above pivot point indicates the bullish position and below pivot points indicates the short position. The red lines show the support levels and the green line indicates the resistance levels. These levels can be used to enter and exit trades.
Strategy: SELL, Stop Loss: 0.9720, Take Profit: 0.9680
Resistance levels: 0.9735, 0.9750, and 0.9770
Support levels: 0.9680, 0.9655, and 0.9600
The material has been provided by InstaForex Company – www.instaforex.com


