
Previous Story
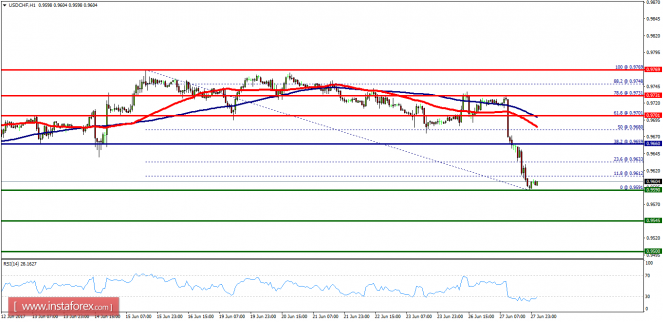
Technical analysis of USD/CHF for June 28, 2017
Posted On 28 Jun 2017
Comment: 0
Overview:
- The USD/CHF pair has kept moving downwards from the level of 0.9701. Yesterday, the pair dropped from the level of 0.9701(this level of 0.9701 coincides with the ratio of 61.8% Fibonacci retracement) to the bottom around 0.9591. Today, the first resistance level is seen at 0.9660 followed by 0.9701, while daily support 1 is seen at 0.9545. According to the previous events, the USD/CHF pair is still moving between the levels of 0.9660 and 0.9545; for that, we expect a range of 115 pips (0.9660 – 0.9545). If the USD/CHF pair fails to break through the resistance level of 0.9545, the market will decline further to 0.9500 in coming days. This would suggest a bearish market because the RSI indicator is still in a positive area and does not show any trend reversal signs. On the contrary, if a breakout takes place at the resistance level of 0.9731 (the double top), then this scenario may become invalidated.
The material has been provided by InstaForex Company – www.instaforex.com


