
Previous Story
Technical analysis of USD/CHF for June 29, 2017
Posted On 29 Jun 2017
Comment: 0
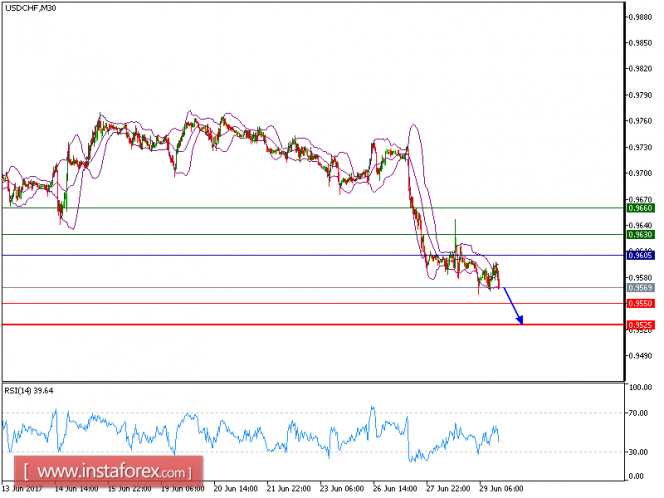
We will keep our yesterday’s negative outlook as the pair is moving downward and now trading at 0.9569. The pair remains under pressure below its nearest resistance at 0.9605, and is likely to test its next support at 0.9550. The risk of a slide below this level remains high, as both the 20-period and 50-period moving averages are heading downward, calling for a new pullback. Besides, the relative strength index is mixed to bearish.
Therefore, as long as 0.9605 holds on the upside, look for a new decline to 0.9550 and 0.9525 in extension.
Chart Explanation: The black line shows the pivot point; the present price above pivot point indicates the bullish position and below pivot points indicates the short position. The red lines show the support levels and the green line indicates the resistance levels. These levels can be used to enter and exit trades.
Strategy: SELL, Stop Loss: 0.9605, Take Profit: 0.9550
Resistance levels: 0.9630, 0.9660, and 0.9685
Support levels: 0.9550, 0.9525, and 0.9500
The material has been provided by InstaForex Company – www.instaforex.com


