
Previous Story
Technical analysis of USD/CHF for March 17, 2017
Posted On 17 Mar 2017
Comment: 0
Overview:
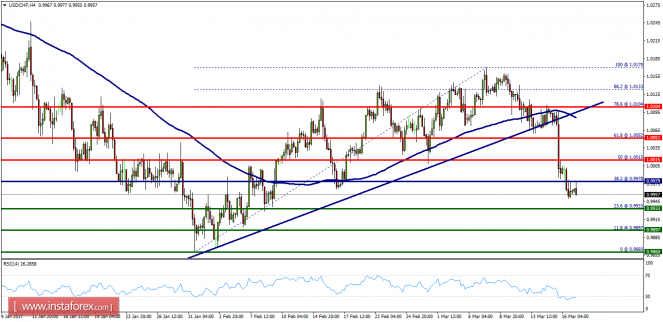
- The USD/CHF pair continues to move downwards from the levels of 1.0104, 1.0052 and 1.0015. The pair dropped from the level of 1.0104 (this level of 1.0104 coincides with the ratio of 78.6% Fibonacci retracement) to the bottom around the spot of 0.9960. Today, the first support level is seen at 0.9933 followed by 0.9897, while daily resistance 1 is found at 1.0052. Amid the previous events, the pair is still in an uptrend, because the USD/CHF pair is trading in a bearish trend from the price of 1.0052 toward the first support level at 0.9978 in order to test it. Therefore, the first bearish wave is seen at 0.9933, for that i the pair succeeds to pass through the level of 0.9933, the market will indicate a bearish opportunity below the level of 0.9978. In other words, sell orders are recommended below the spot of 0.9978 with the first target at the level of 0.9933; and continue toward 0.9897. On the other hand, if the NZD/USD pair fails to break through the major resistance level of 1.0104 today, then you should set your stop loss at 1.0150.
The material has been provided by InstaForex Company – www.instaforex.com


