
Previous Story
Technical analysis of USD/CHF for November 16, 2017
Posted On 16 Nov 2017
Comment: 0
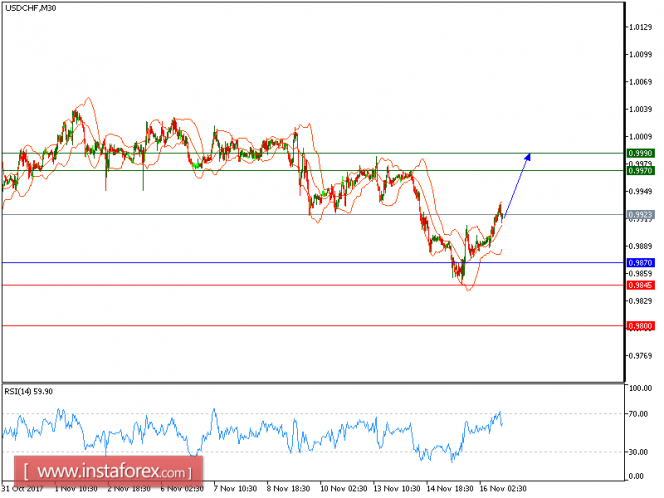
USD/CHF is expected to trade with a bullish bias above 0.9870. The pair stands above its key horizontal support at 0.9870, and is expected to post a new bounce. Besides, the relative strength index is bullish above its neutrality area at 50. The 20-period moving average is turning up, and advocates for a new rebound.
In conclusion, as long as 0.9870 is not broken, look for 0.9970 and 1.0015 in extension.
Chart Explanation: The black line shows the pivot point. The present price above the pivot point indicates a bullish position, and the price below the pivot points indicates a short position. The red lines show the support levels and the green line indicates the resistance levels. These levels can be used to enter and exit trades.
Strategy: BUY, Stop Loss: 0.9870, Take Profit: 0.9970
Resistance levels: 0.9970, 0.9990, and 0.1035
Support levels: 0.9845, 0.9800, and 0.9765
The material has been provided by InstaForex Company – www.instaforex.com
Source:: Technical analysis of USD/CHF for November 16, 2017


