
Previous Story
Technical analysis of USD/CHF for September 19, 2017
Posted On 19 Sep 2017
Comment: 0
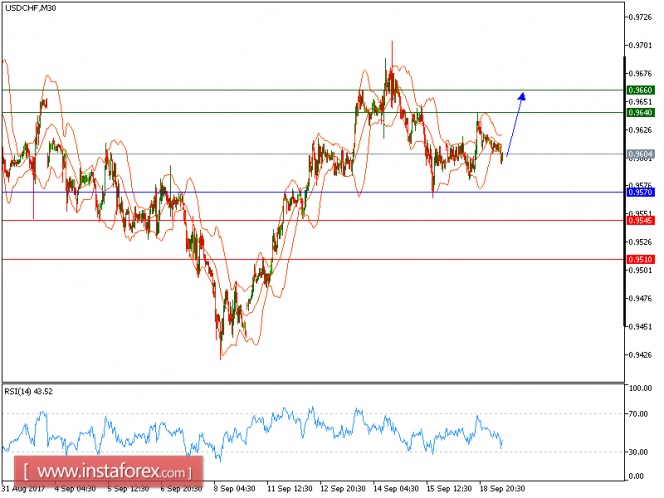
USD/CHF is expected to trade with a bullish bias above 0.9570. The pair posted a rebound and broke above its 20-period and 50-period moving averages. The relative strength index is above its neutrality level at 50 and lacks downward momentum.
Federal-funds futures showed Monday that the odds of the central bank increasing interest rates again by December grew to 57% from 41% a week earlier, according to CME Group data. The U.S. dollar is gathering strength along with rallying Treasury yields.
To conclude, as long as 0.570 is not broken, look for a technical rebound with targets at 0.9640 and 0.9660 in extension.
Chart Explanation: The black line shows the pivot point. The present price above the pivot point indicates a bullish position, and the price below the pivot points indicates a short position. The red lines show the support levels and the green line indicates the resistance levels. These levels can be used to enter and exit trades.
Strategy: BUY, Stop Loss: 0.9570, Take Profit: 0.9640
Resistance levels: 0.9640, 0.9660, and 0.9680
Support levels: 0.9545, 0.9510, and 0.9470
The material has been provided by InstaForex Company – www.instaforex.com
Source:: Technical analysis of USD/CHF for September 19, 2017


