
Previous Story
Technical analysis of USD/JPY for December 08, 2017
Posted On 08 Dec 2017
Comment: 0
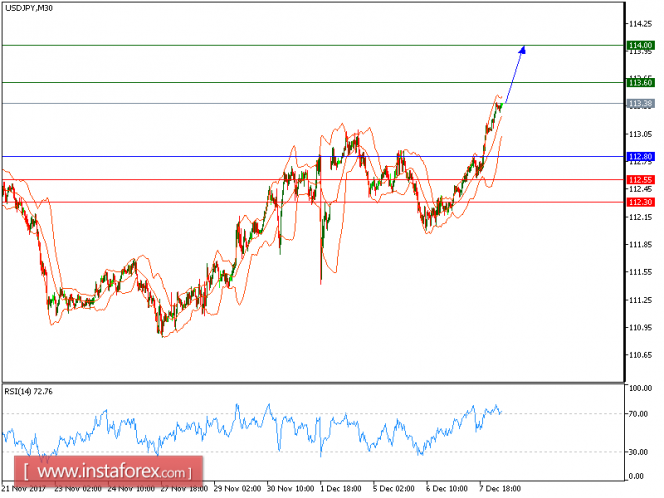
All our upside targets which we predicted in yesterday’s analysis have been hit. The pair proceeds toward the overhead resistance at 114 while maintaining its footing on an uptrend drawn from December 6. Extra support is provided by the ascending 20-period moving average. Meanwhile, the relative strength index has entered the over-bought region of the 70s but there is no sign of a bearish reversal. As strong intraday bullishness persists, the pair should target the next resistance at 113.60 upon reaching 113.35. The trailing key support has been raised to 112.80.
Alternatively, if the price moves in the opposite direction, a short position is recommended below 112.80 with a target of 112.55.
Chart Explanation: The black line shows the pivot point. The current price above the pivot point indicates a bullish position, while the price below the pivot point is a signal for a short position. The red lines show the support levels and the green line indicates the resistance level. These levels can be used to enter and exit trades.
Strategy: BUY, Stop Loss: 112.80, Take Profit: 113.60
Resistance levels: 113.60, 114.00 and 114.45 Support Levels: 112.55, 112.30, 112.00
The material has been provided by InstaForex Company – www.instaforex.com
Source:: Technical analysis of USD/JPY for December 08, 2017


