
Previous Story
Technical analysis of USD/JPY for July 17, 2017
Posted On 17 Jul 2017
Comment: 0
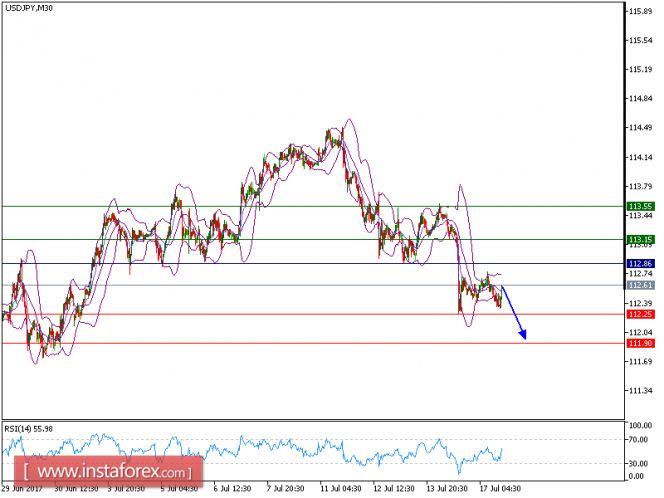
USD/JPY is under pressire. The pair has recorded lower tops and lower bottoms since July 14, which confirms a negative outlook. The declining 50-period moving average is playing a resistance role. The relative strength index is below its neutrality level at 50.
Therefore, as long as 112.85 holds on the upside, look for a further downside to 112.25 and even to 111.90 in extension
Alternatively, if the price moves in the opposite direction than predicted, a downside long position is recommended above 112.85 with a target at 113.15.
Chart Explanation: The black line shows the pivot point. The current price above the pivot point indicates a bullish position while the price below the pivot point is a sign for a short position. The red lines show the support levels and the green line indicates the resistance level. These levels can be used to enter and exit trades.
Strategy : SELL , Stop Loss: 112.85, Take Profit: 112.25
Resistance levels: 113.15, 113.55, and 113.95
Support levels: 112.25,111.90, and 111.45
The material has been provided by InstaForex Company – www.instaforex.com


