
Previous Story
Technical analysis of USD/JPY for March 14, 2017
Posted On 14 Mar 2017
Comment: 0
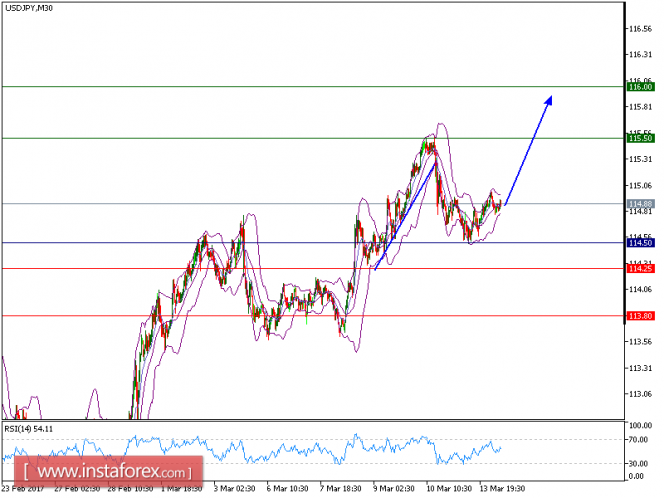
USD/JPY is turning up. The pair posted a rebound and broke above the 20-period and 50-period moving averages. In addition, the 20-period moving average crossed above the 50-period one, which indicated a positive signal. The relative strength index shows upward momentum.
Therefore, as long as 114.50 holds on the downside, look for a further upside to 115.50 and even to 116.00 in extension.
The pair is trading below its pivot point. It is likely to trade in a lower range as long as it remains below the pivot point. Short positions are recommended with the first target at 114.25. A break below this target will move the pair further downwards to 113.80. The pivot point stands at 115.15. If the price moves in the opposite direction and bounces back from the support level, it will move above its pivot point. It is likely to move further to the upside. According to that scenario, long positions are recommended with the first target at 115.50 and the second one at 116.00.
Resistance levels: 115.50, 116.00, and 116.45
Support levels: 114.25, 113.80, and 113.35
The material has been provided by InstaForex Company – www.instaforex.com


