
Previous Story
Technical analysis of USD/JPY for May 12, 2017
Posted On 12 May 2017
Comment: 0
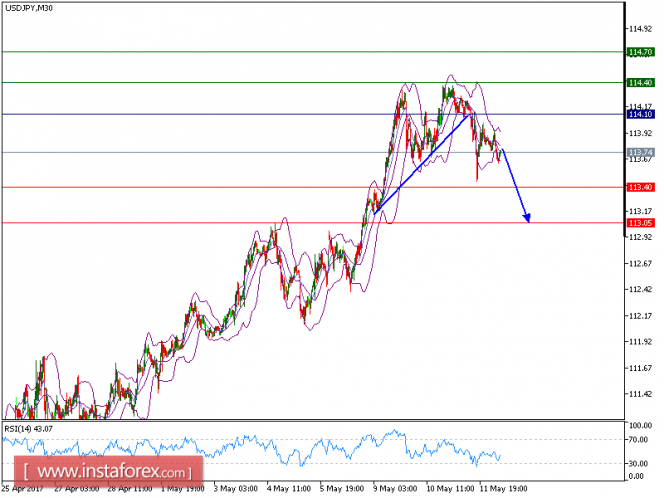
USD/JPY is under pressure. The pair broke below its intraday triangle pattern, and is now turning down. The 50-period moving average has also reversed down, and is acting as a key resistance. Besides, the relative strength index remains capped by its declining trend line.
In which case, as long as 114.10 is not surpassed, the pair is likely to decline to 113.40 and 113.05 in extension.
The pair is trading below its pivot point. It is likely to trade in a lower range as long as it remains below the pivot point. Short positions are recommended with the first target at 113.40. A break below this target will move the pair further downwards to 113.05. The pivot point stands at 114.10. If the price moves in the opposite direction and bounces back from the support level, it will move above its pivot point. It is likely to move further to the upside. According to that scenario, long positions are recommended with the first target at 114.40 and the second one at 114.70.
Resistance levels: 114.40, 114.70, and 115.00
Support levels: 113.40, 113.05, and 112.65
The material has been provided by InstaForex Company – www.instaforex.com


