
Previous Story
Technical analysis of USD/JPY for September 08, 2017
Posted On 08 Sep 2017
Comment: 0
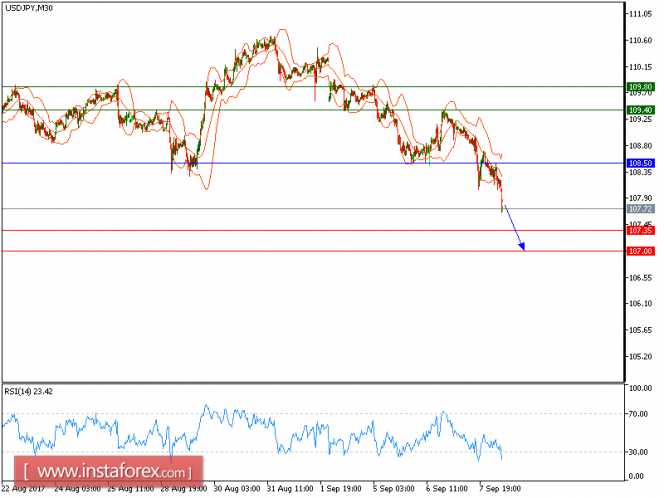
USD/JPY is under pressure and expected to prevail its downside movement. The pair is trading below its declining 20-period and 50-period moving averages, which play resistance roles and maintain the downside bias. The relative strength index is bearish and calls for a further decline.
Hence, as long as 108.50 holds on the upside, look for a further decline to 107.35 and even to 107.00 in extension.
Alternatively, if the price moves in the opposite direction, a long position is recommended above 108.50 with a target at 109.40.
Chart Explanation: The black line shows the pivot point. The current price above the pivot point indicates a bullish position, while the price below the pivot point is a signal for a short position. The red lines show the support levels and the green line indicates the resistance level. These levels can be used to enter and exit trades.
Strategy: SELL, Stop Loss: 108.50, Take Profit: 107.35
Resistance levels: 109.40, 109.80, and 110.35
Support Levels: 107.35, 107.00, 106.40
The material has been provided by InstaForex Company – www.instaforex.com
Source:: Technical analysis of USD/JPY for September 08, 2017


