
Previous Story
Technical analysis of USD/JPY for September 19, 2017
Posted On 19 Sep 2017
Comment: 0
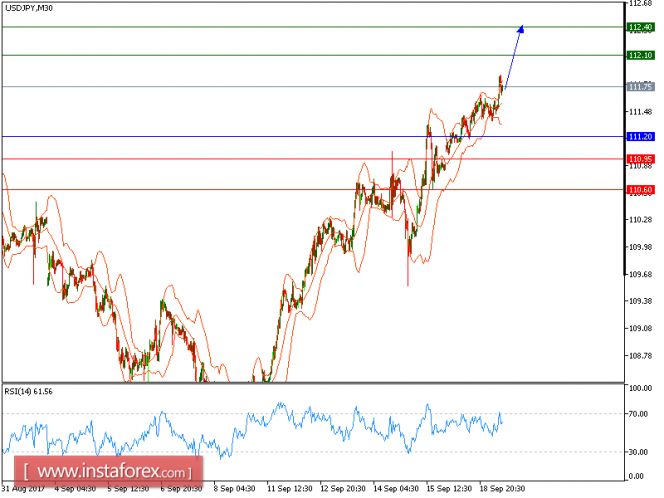
Our first target which we predicted at 111.70 in yesterday’s analysis has been hit. The pair is trading above its rising 50-period moving average, which plays a support role and maintains the upside bias. The relative strength index is mixed with a bullish bias. The downside potential should be limited by the key support at 110.60.
Hence, as long as this key level is not broken, look for a new upside to 112.10 and even to 112.40 in extension.
Alternatively, if the price moves in the opposite direction, a short position is recommended below 110.60 with a target at 110.30.
Chart Explanation: The black line shows the pivot point. The current price above the pivot point indicates a bullish position, while the price below the pivot point is a signal for a short position. The red lines show the support levels and the green line indicates the resistance level. These levels can be used to enter and exit trades.
Strategy: BUY, Stop Loss: 111.20, Take Profit: 112.10
Resistance levels: 112.10, 112.40, and 112.75 Support Levels: 110.95, 110.60, 110.20
The material has been provided by InstaForex Company – www.instaforex.com
Source:: Technical analysis of USD/JPY for September 19, 2017


