
Previous Story
Technical analysis of USDX for January 5, 2018
Posted On 05 Jan 2018
Comment: 0
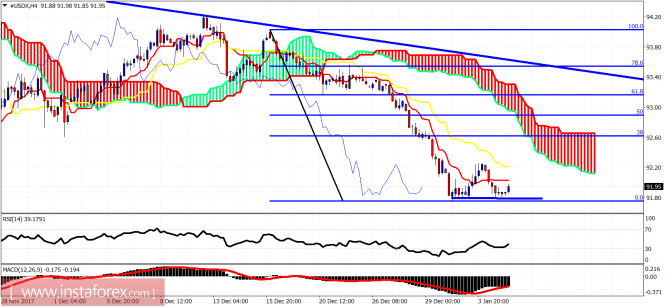
The US dollar index is showing reversal signs after retesting the recent low at 91.75 and the forming a double bottom pattern. As long as we are above 91.75, we could see a bounce towards the 92.70-92.50 area.
Horizontal blue line – support
Downward sloping blue line – resistance
The US dollar index is expected to bounce at least towards the 38% Fibonacci retracement near the Ichimoku cloud at 92.60 over the coming days. The double bottom formation, as long as it is not broken downwards, should give the dollar a push higher.
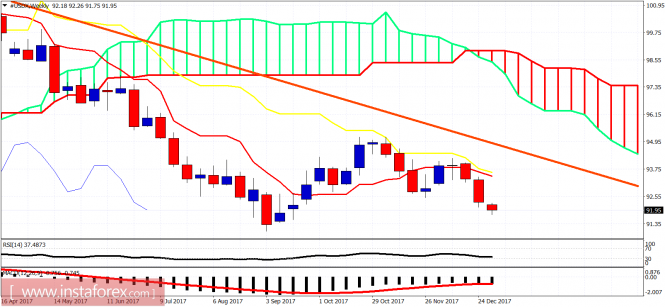
On a weekly basis, the trend remains bearish as long as the price is below 93.75. Today’s weekly close will be important and will give us a clue for what to expect next week. There are many chances of a full-scale upward reversal and move towards 97, but we need to see some reversal signs starting today.The material has been provided by InstaForex Company – www.instaforex.com


