
Previous Story
Technical analysis of USDX for July 20, 2017
Posted On 20 Jul 2017
Comment: 0
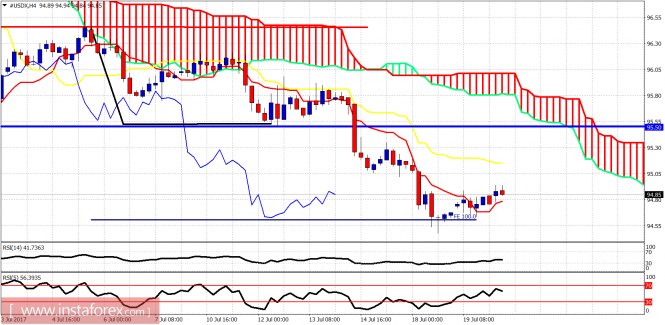
The Dollar index is bouncing off the 94.50 area towards 95 where we find the previous lows and the kijun-sen indicator as resistance. Trend remains bearish as long as price is below 95.80.
Red line – resistance
Blue line – resistance (former broken support)
The Dollar index is in a bearish trend. Price is above the tenkan-sen (Red line indicator) and this implies we could see price move towards the kijun-sen (yellow line indicator) at 95.15. Cloud resistance is at 95.50-95.80. Price continues to make lower lows and lower highs. No trend reversal signal yet.
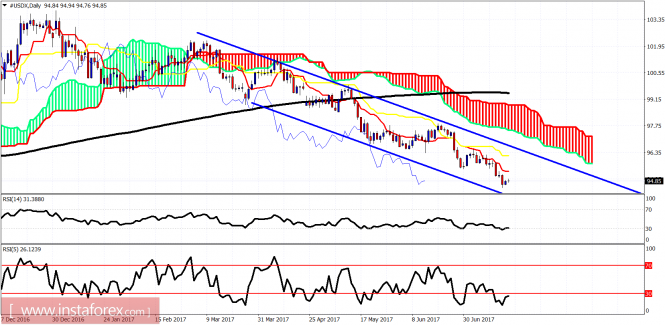
Blue lines – bearish channel
The Dollar index remains inside the bearish channel and below both the tenkan- and kijun-sen indicators. Price is also below the 200 Day MA. Daily resistance is at 95.50-96.20 area. As long as we trade below these levels, we are in a bearish daily trend looking for a move towards 92.
The material has been provided by InstaForex Company – www.instaforex.com


