
Previous Story
Technical analysis of USDX for March 17, 2017
Posted On 17 Mar 2017
Comment: 0
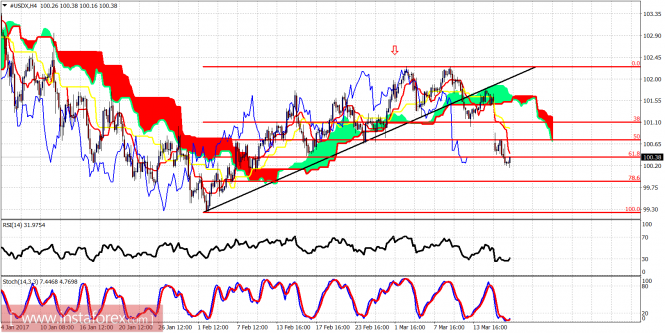
The Dollar index has broken through the 61.8% Fibonacci retracement support but it shows reversal signs. Short-term trend is bearish. Medium-term trend is neutral. Long-term trend remains bullish.
After the double top we mentioned at 102.30, the Dollar index broke support and fell sharply after the FOMC meeting last Wednesday. Price has reached our short-term target and support area at 100.30. Oscillators are oversold,so a bounce towards 101 is expected.
Red line – resistance
Black line – neckline support
Green line – long-term trend line support
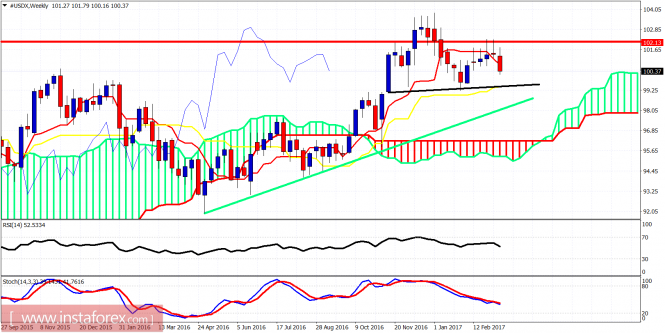
The Dollar index is most probably forming a right hand shoulder in a bearish Head and Shoulders pattern that has a neckline support (black line) at 99.25. The Dollar index has broken below the weekly tenkan-sen (Red line indicator) and is heading towards the kijun-sen support (yellow line indicator). Important weekly resistance is at 101.80 and at 102.30. Bears are in control. Bulls need to show more constructive price action above at least 101.80 in order to regain control.
The material has been provided by InstaForex Company – www.instaforex.com


