The World of the VIX
The VIX, or Volatility Index, is among the most watched indices in the world, certainly on the CBOE (Chicago Board of Exchange), with most traders checking it at least once a day. Unlike most indices, the VIX’s price is not comprised of stocks, bonds or options. What the VIX measures is volatility around the S&P500 index. Why should you watch the VIX and when should you use it? Those are the two questions that this article sets out to answer.
Why Bother with the VIX?
As mentioned, the VIX measures the volatility around the S&P500 index, or more accurately the implied volatility around the S&P500 index. You might wonder, “What’s the difference?” Implied volatility is expected volatility, and since in trading tomorrow is the present, that difference does matter. As an index, the
VIX: Under the Hood
The VIX is basically composed of the premium that investors are willing to pay for both call and put options on the S&P500. The average expiry date for those options is approximately 30 days and that tends to be when implied volatility is most indicative. The higher that premium, the higher the VIX will be. If we were to link back to the risk on/risk off trade, if investors are worried that risk is on the rise (which causes implied volatility in the S&P500 to jump) then the VIX simultaneously rises. When investors are calm, implied volatility falls and the VIX is lower.
There have, of course, been days when the VIX was rising and market was in risk on mode (and vice versa), but those cases are generally rare. Naturally, as a trader, you must always be aware that anything can happen at any time.
When to Use the VIX?
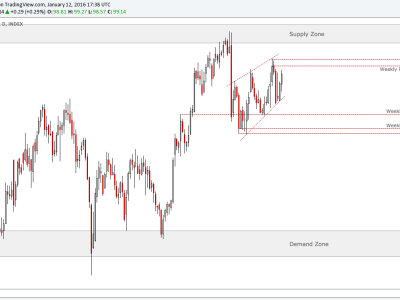
Now, here is the tricky part of the VIX; the VIX is what is known as a contrarian indicator. That means it is more useful as an indication of a risk of a change rather than an indication of the current trend. Behaviorally, the VIX can be likened to an elastic material; it always tends to gravitate back to balance. When the VIX is at record highs it tends to move back lower. When it’s recovered and hits a fresh low then it tends to move higher. While it’s important to always keep track of the VIX, as seen below, the extreme levels can suggest if the market is in a risk on/risk off mode. When the VIX is at record highs, it might be time to trade on a risk on mode. Why? Because market jitters are likely to wane and therefore risk related trades (i.e. long AUD, EUR, GBP, SPX, etc.) might be the wisest trade. Naturally, the opposite also (generally) holds true.
Source: CBOE
VIX has Cousins
Among all of the indices that measure volatility, the VIX is the most important, especially given the S&P500’s correlation with nearly every asset class. But what happens when you want greater accuracy or more relevance to your current trade (e.g. Forex, commodities or other global Indices)? While the VIX may be the granddaddy of them all, there is a “family” of volatility indices linked to specific indices, asset classes and even to specific trades. For example, the OVX measures the implied volatility on Oil, while the EUVIX measures the implied volatility on the Euro. Can’t wait to meet the rest of the “family”?
Want to learn how to use other VIX indicators? Then stay tuned for my next article.
The post The World of the VIX appeared first on MetaTrader Expert Advisor.
Source:: The World of the VIX


