
Previous Story
Thursday 11th December: High-impacting news events will likely affect major currency markets today – remain vigilant.
Posted On 11 Dec 2014
Comment: 0
EUR/USD:
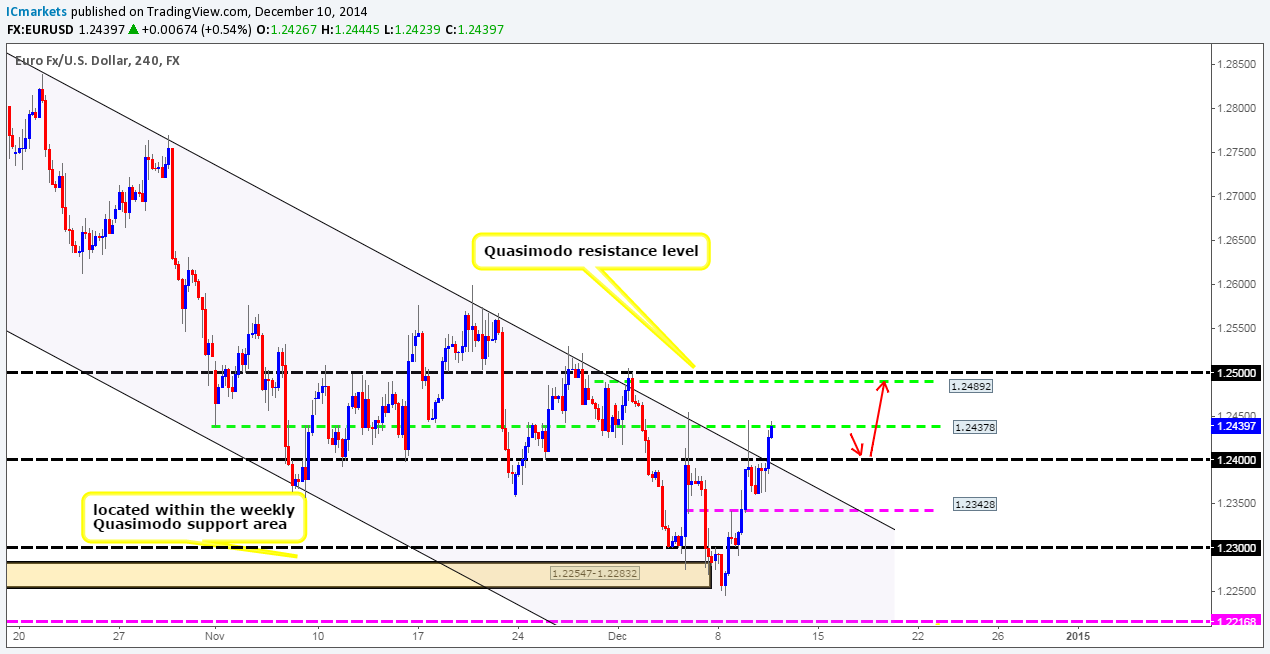
Weekly Timeframe: Further buying has been seen from the weekly Quasimodo support area coming in at 1.22403-1.22942. Will the market continue to rally until it reaches 1.24996, a minor weekly swap level? Let’s take a look on the lower timeframes to see what we can find.
Daily Timeframe: The daily timeframe shows that the buyers and sellers are currently battling for position within a daily supply area seen at 1.25056-1.24180. Most of the selling opposition will need to be consumed here before the market can hit 1.24996.
4hr Timeframe: A relatively strong breakout above a 4hr downtrend channel has recently been seen on the Euro. This will likely get breakout traders buying with excitement, not knowing they’ve effectively just bought into not only a 4hr swap level at 1.24378, but also into the aforementioned daily supply area as well.
We would rather wait for some sort of confirmation before buying into this break. The most likely scenario we see playing out is as follows. The market will likely rally a little higher up towards 1.24500 (the Euro tends to react of off this number frequently) before seeing active selling, bringing prices back down towards 1.24. It would be at this point we’d begin looking for lower-timeframe confirmation around the 1.24051 mark, with a take-profit target likely set around 1.24835, just below a 4hr Quasimodo resistance level at 1.24892 (located 10 or so pips below the weekly swap level mentioned above at 1.24996).
Current buy/sell levels:
- Buy orders: 1.24051 [Tentative] (Predicative stop-loss orders seen at: Dependent on where this level is confirmed).
- Sell orders: Flat (Predicative stop-loss orders seen at: N/A).
GBP/USD:
Weekly Timeframe: At this point in time, the buyers and sellers are battling around a weekly swap level seen at 1.57166. A weekly close above this level would likely entice further buying, and push prices north up to 1.58934, another weekly swap level.
Daily Timeframe: The daily timeframe shows that Monday’s trading sessions broke below a daily decision-point demand area seen at 1.55602-1.56802, which likely triggered the recent rally up to 1.57166. Very similar to the weekly analysis – if a break above 1.57166 is seen, prices will likely be forced north up towards a daily supply area coming in at 1.59438-1.58338, which coincidentally surrounds the weekly swap level seen at 1.58934.
4hr Timeframe: It was mentioned in the previous analysis that the 4hr decision-point demand area at 1.56249-1.56455 was likely going to be troublesome for those who sold around 1.57. And as we can all see this has indeed happened.
Now, considering that price is trading around higher-timeframe resistance at the moment (see above), it would be only natural to think ‘go short’, and normally we’d agree. However, check out the current price action on the 4hr timeframe. Notice the wicks seen at 1.57158/1.57247 marked with blue arrows? These spikes likely consumed a ton of sellers and likely trapped an equal amount of breakout buyers in the process. The point we’re trying to make is with all the sellers taken out, prices can trade higher up to at least the 4hr supply area looming just above at 1.57629-1.57334, which in our opinion is a beautiful zone to be looking for short entries around 1.57282. However once/if this order is filled, one should watch 1.57 closely, as ultimately we’d want to see this level consumed thus giving us confidence to leave the trade in play.
Current buy/sell levels:
- Buy orders: Flat (Predicative stop-loss orders seen at: N/A).
- Sell orders: 1.57282 (Predicative stop-loss orders seen at: 1.57712).
AUD/USD:
Weekly Timeframe: The weekly timeframe shows that price is seeing a reaction off of a long-term downtrend channel support (0.97569/0.88468), deep within a major weekly demand area coming in at 0.80646-0.84601.
Daily Timeframe: The buyers still seem to be holding out just above a daily swap level seen at 0.82625 (lines up beautifully with the weekly downtrend channel support). Our bias for the Aussie is currently long, and will only be challenged if price closes below this level.
4hr Timeframe: The 4hr timeframe shows that a decline in value was indeed seen down to just above the 4hr Quasimodo support level seen at 0.82588, as reported it may do in the previous analysis. From there a rally higher ensued closing above 0.83 and at the time of writing is being retested as support. As long as the buyers can hold prices above 0.83, we feel there is a good chance that the market will see further buying up to a 4hr supply area coming in at 0.83894-0.89676. So much so, we are currently watching the 15/5 minute timeframes for a confirmed entry long here, but as of yet we do not see anything that takes our fancy.

Current buy/sell levels:
- Buy orders: Currently watching for a confirmed buy entry around 0.83 (Predicative stop-loss orders seen at: Dependent on where one confirms the level).
- Sell orders: Flat (Predicative stop-loss orders seen at: N/A).
USD/JPY:
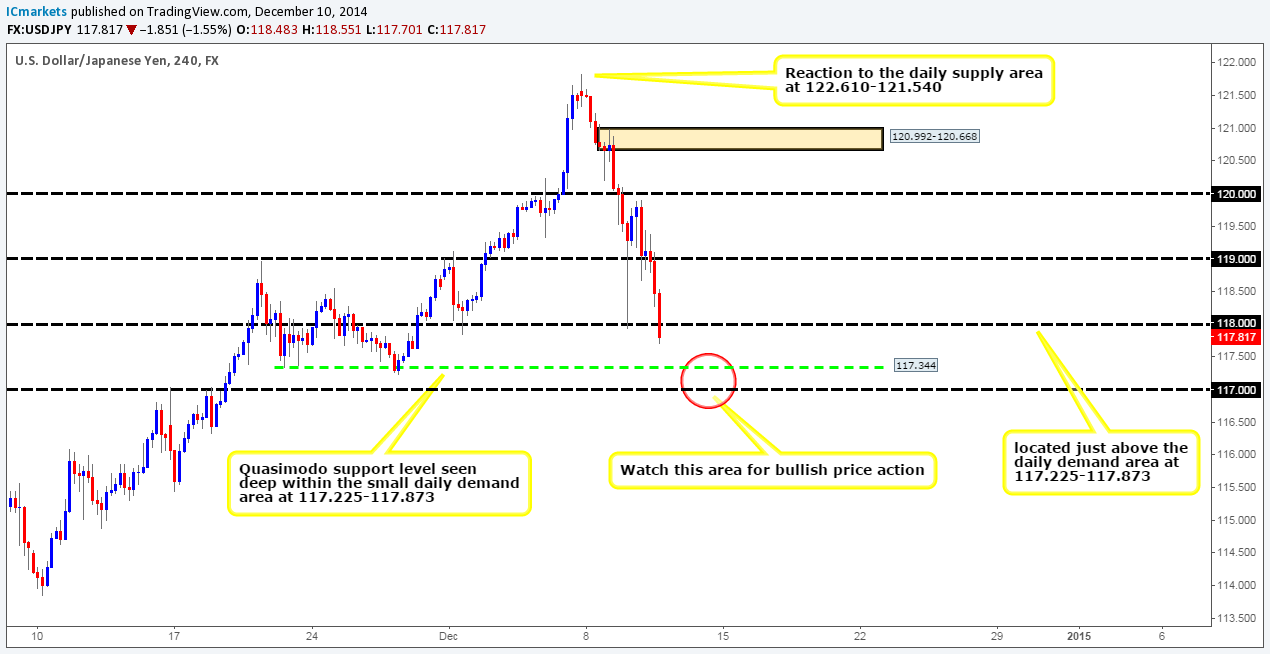
Weekly Timeframe: Aggressive selling has been seen on the USD/JPY pair from just below a weekly Quasimodo resistance level at 122.180. This has consequently forced prices down to a weekly swap area coming in at 117.931-116.799. Let’s take a look on the lower timeframes to see what we can find.
Daily Timeframe: The daily timeframe shows that the buyers and sellers are currently battling for position around a small daily demand area seen at 117.225-117.873. Assuming that the sellers are victorious here, we feel there is a good chance that further selling will be seen down towards a major daily swap level coming in at 115.503.
4hr Timeframe: A sell off has recently been seen on the USD/JPY pair consequently bringing prices down to around 118 (seen just above the daily demand area at 117.225-117.873). In the event that a 4hr close is seen below here, this will likely encourage further selling down towards 117.344, a 4hr Quasimodo support level (seen very deep within the aforementioned daily demand area). We would be very interested in buying here around the 117.398 mark, but only with lower-timeframe confirmation mind you. The reason being is simply because pro money may fake price into 117 to gather liquidity in the form of sell stops from traders attempting to fade, and also break buyers’ sell orders to buy into.
Current buy/sell levels:
- Buy orders: 117.398 [Tentative] (Predicative stop-loss orders seen at: 116.924).
- Sell orders: Flat (Predicative stop-loss orders seen at: N/A).
USD/CAD:
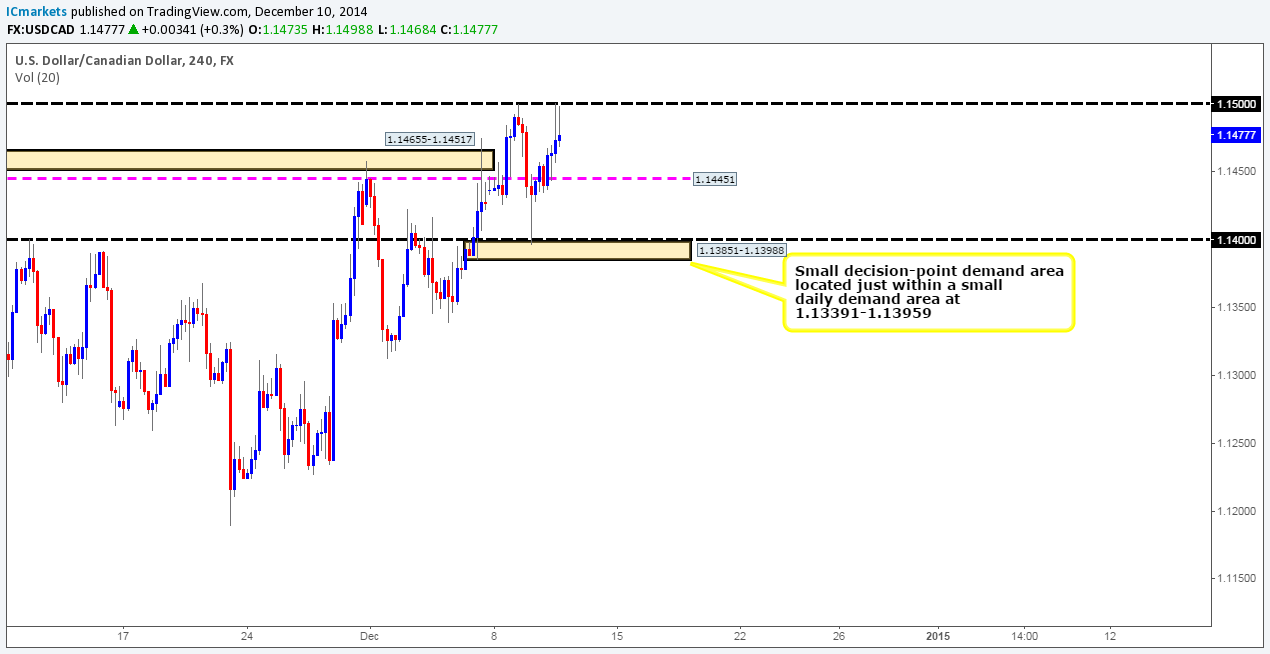
Weekly Timeframe: The weekly timeframe is showing that current price is trading just below a major weekly supply area coming in at 1.18061-1.14739 at the moment. In the event that active sellers enter the market here, we could potentially see prices decline down towards a weekly swap level seen at 1.12231.
Daily Timeframe: The daily timeframe shows that the market is currently being held lower by a major daily swap level seen at 1.14861. If this level is taken out, this could then create enough upside momentum to test a daily supply area coming in at 1.17225-1.15458 (located relatively deep within the aforementioned weekly supply area).
4hr Timeframe: For anyone who follows our analysis on a regular basis, you may recall us mentioning that if prices broke above 1.14451, and retested it as support, we’d consider entering long. We did indeed get a beautiful buy signal around 13.15 pm GMT time yesterday when price faked below the low 1.14456 at 1.14433. Our fill was at 1.14489, and we took full profit at 1.14786. Not too bad considering our stop was set at 1.14412.
At the time of writing, selling wicks are being seen around 1.15 which is not surprising really considering that the market is trading around both a weekly supply area, and just below a major daily swap level (for levels – see above) at the moment. We are not interested in buying or selling this pair until price breaks either 1.15, or 1.14451 since trading at current price offers us no logical targets.
Current buy/sell levels:
- Buy orders: Flat (Predicative stop-loss orders seen at: N/A).
- Sell orders: Flat (Predicative stop-loss orders seen at: N/A).
DAX 30:
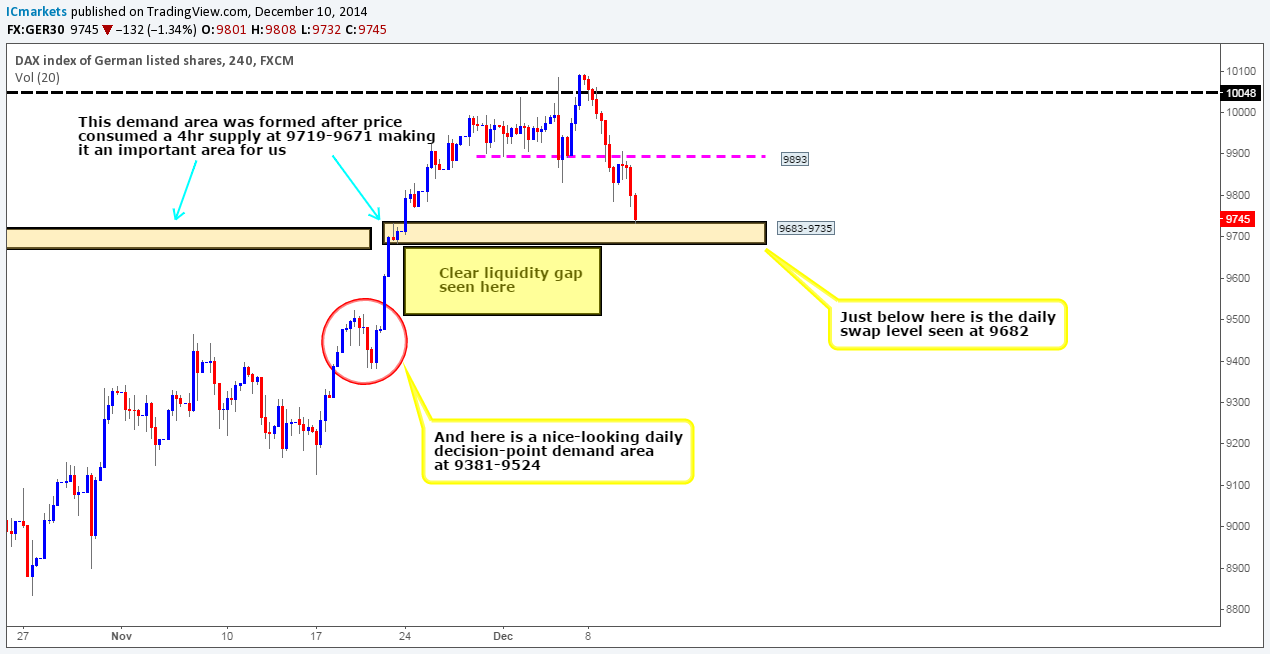
Weekly Timeframe: The weekly timeframe shows that the German index is seeing relatively aggressive selling at the moment. The last session saw the market push below 9790, a weekly swap level. Is there a chance that we may see further selling down towards a weekly decision-point demand area at 9126-9467?
Daily Timeframe: Friday saw the market break above a daily resistance zone at 10048-10007, and coupled with Monday’s trading session, a two-bar reversal pattern printed, essentially forming the beginnings of a fakeout. From there on, follow-through selling was seen resulting in prices closing below the aforementioned weekly swap level. In our opinion, this move has potentially cleared the path south for prices to test 9682, a daily swap level. Let’s see what the 4hr timeframe shows.
4hr Timeframe: There was clearly too much selling power around 9893 for the buyers to contend with yesterday, as a rather aggressive sell off was seen down towards a 4hr demand area coming in at 9683-9735 where the market closed for the day.
That being the case, for further selling to be seen on the DAX as both the weekly and daily timeframes are indicating, this 4hr demand area will need to be consumed. Assuming that this happens today, or even tomorrow, we see a clear run down towards a daily decision-point demand area coming in at 9381-9524 (circled in red). This would give us ample reward to our risk if we shorted a retest down to here.
Current buy/sell levels:
- Buy orders: Flat (Predicative stop-loss orders seen at: N/A).
- Sell orders: Flat (Predicative stop-loss orders seen at: N/A).
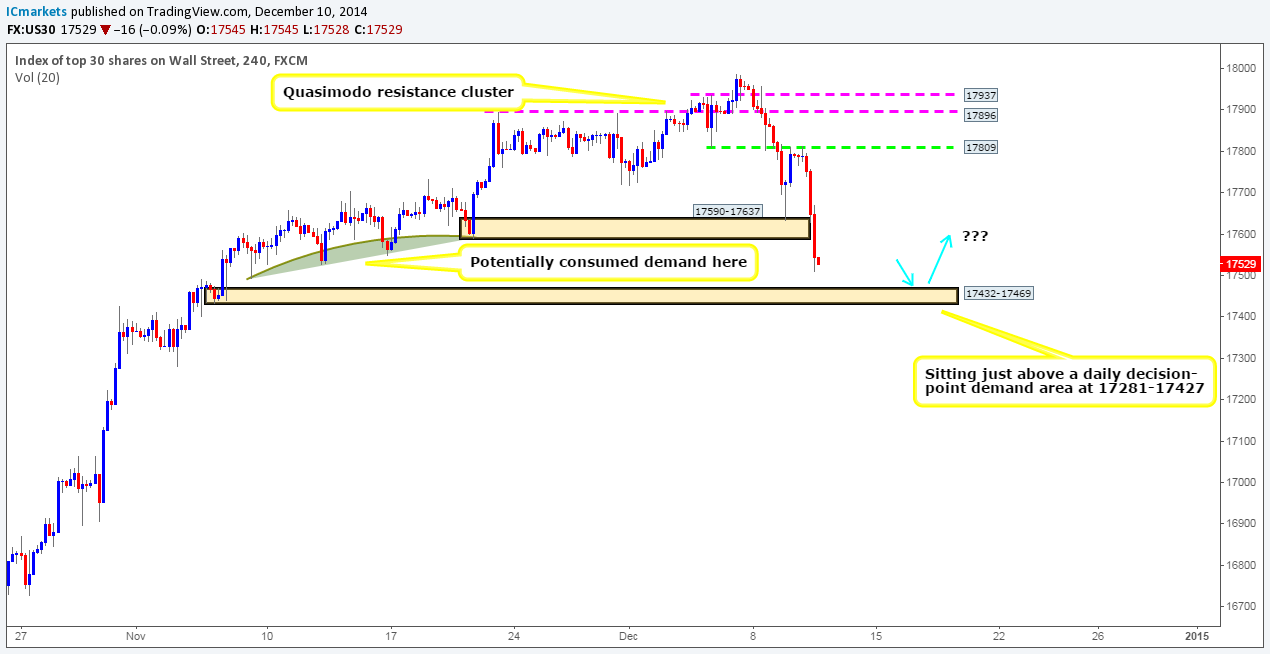
DOW 30:
Weekly Timeframe: The DOW has been trading beautifully within a nice-looking trending channel for over five years, and shows no signs of slowing down just yet. The recently closed weekly candle informed us that the buyers once again remained in control. However, at this point in time, the current weekly candle is showing rather aggressive selling interest from 17972; let’s see what the lower timeframes have to say about this.
Daily Timeframe: The daily timeframe shows that price closed below a daily demand area coming in at 17590-17689 yesterday, which in turn likely cleared the path down to a daily decision-point demand area seen at 17281-17427. The reason why we believe prices could decline this far is simply because of what price action is telling us to the left. Check out when price was rallying north, spikes south were also seen too (17527/17549/17590), this was likely pro money collecting unfilled buy orders to continue rallying higher, but what this also did at the same time was potentially clear the path south for future selling.
4hr Timeframe: In our previous analysis, we mentioned that for anyone who wished to sell around 17809 may benefit from waiting for lower-timeframe confirmation. There was a beautiful sell signal that came in the form of a fakeout above the high 17812 at 17815 around 01.30am GMT time seen on the 30-minute timeframe. We actually missed this entry!!!!! Look at the potential risk/reward this trade would’ve created.
With the 4hr demand area at 17590-17637 well and truly consumed now, the next area of interest we have our eye on comes in at 17432-17469, a 4hr demand area that sits just above the aforementioned daily decision-point demand area. We are a little concerned about this area’s validity though simply because of the spike seen into it on the 06/11/14 at 17440, as this could have consumed serious buyers here. With that being said, we still feel there’s a good chance a reaction could be seen from here, and as such we are going to be watching for lower-timeframe buying confirmation around the 17481 mark.
Current buy/sell levels:
- Buy orders: 17481 [Tentative] (Predicative stop-loss orders seen at: 17415).
- Sell orders: Flat (Predicative stop-loss orders seen at: N/A).
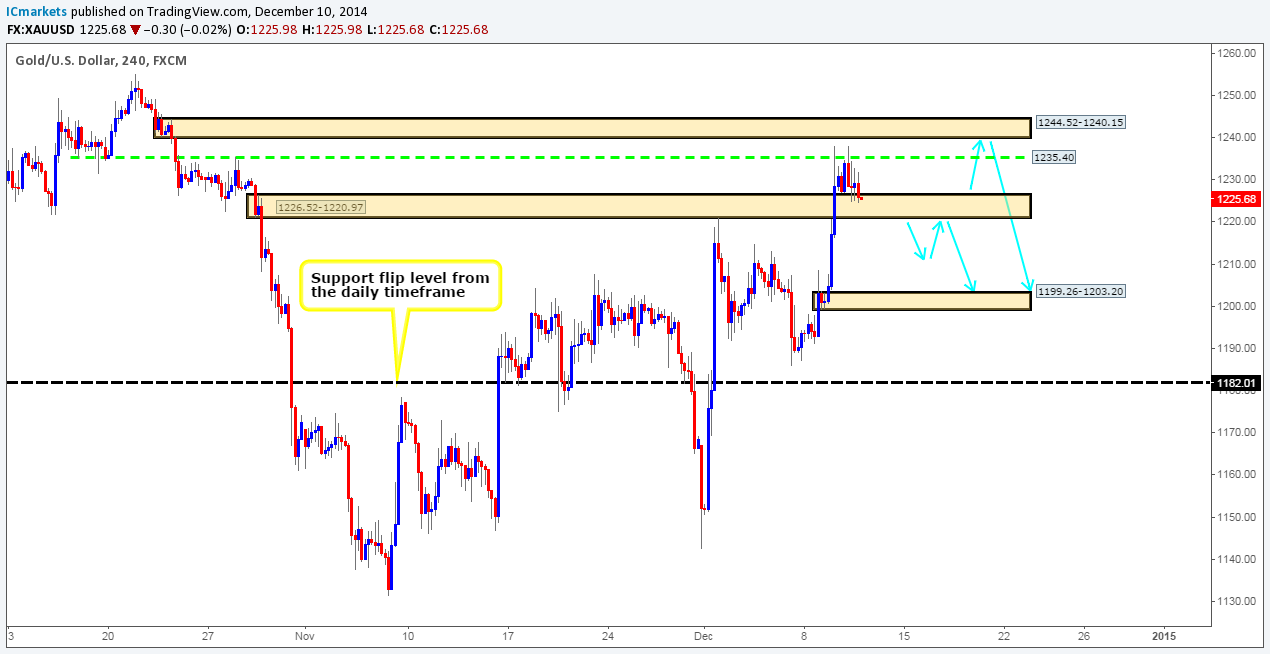
XAU/USD (Gold):
Weekly Timeframe: The weekly timeframe shows that Gold is currently being bought against the U.S Dollar, and as a result prices have been push above 1202.91 into a fresh weekly supply area coming in at 1255.20-1226.18. It will be interesting to see what the lower timeframes have to say about this.
Daily Timeframe: The daily timeframe shows that the recent buying momentum has forced prices above a daily decision-point supply area at 1235.51-1222.37 (located just within the aforementioned weekly supply area), which resulted in price forming two selling wicks. In the event that sellers come into the market here, we can likely expect price to test a daily demand area seen at 1185.97-1203.20. Conversely, if the two selling wicks turn out to be consumption wicks, and higher prices are seen, this will likely force the market north to test a daily Quasimodo resistance level coming in at 1249.45 (located very deep within the aforementioned weekly supply area).
4hr Timeframe: Buyers and sellers are currently seen trading in between a 4hr swap level coming in at 1235.40 (located relatively deep within the aforementioned weekly supply area), and a 4hr swap area seen at 1226.52-1220.97.
If price breaks north here into a small 4hr supply area seen just above at 1244.52-1240.15, this could be a nice little area to short at around 1239.32 with a stop set just above at 1246.67, as let’s not forget, price is trading around a fresh weekly supply at the moment. Equally, assuming that price closes below the aforementioned 4hr swap area, this would be our cue to start watching for selling opportunities on a possible retest (as per the blue arrows) using lower-timeframe confirmation, targeting a small 4hr decision-point demand area seen at 1199.26-1203.20 (located just within the daily demand area mentioned above at 1185.97-1203.20).
Current buy/sell levels:
- Buy orders: Flat (Predicative stop-loss orders seen at: N/A).
- Sell orders: 1239.32 (Predicative stop-loss orders seen at: 1246.67).
The post Thursday 11th December: High-impacting news events will likely affect major currency markets today – remain vigilant. appeared first on .


