
Previous Story
Thursday 19th June: Daily technical outlook and review.
Posted On 19 Jun 2014
Comment: 0
For the readers’ benefit:
Price action confirmation: simply means traders will likely wait for price action to confirm a level by consuming the opposing supply or demand area, then entering a trade on a possible retracement, this may occur on the lower timeframes also.
Pending orders: means pending orders are likely seen.
EUR/USD:
4hr TF.
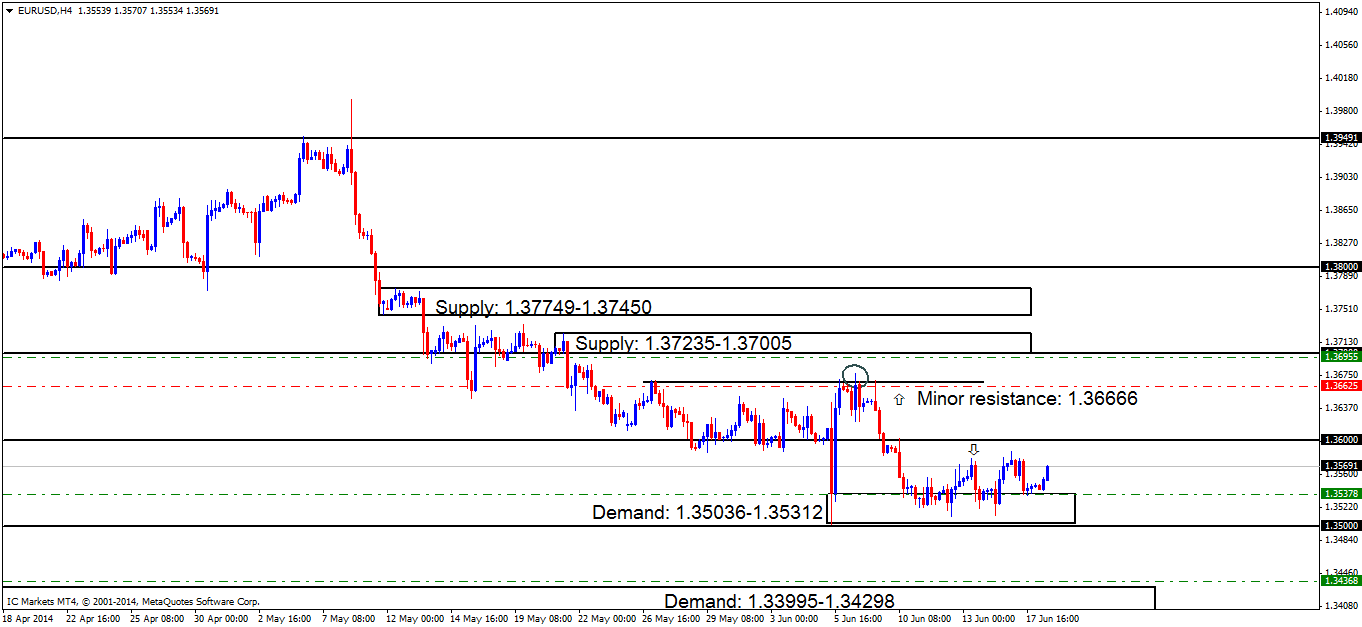
The last analysis reported that price would likely retrace back to the origin around demand below at 1.35036-1.35312, which did in fact happen, along with our pending buy order set at 1.35378 being filled with little to no drawdown.
The first target for this active long trade is at the round number 1.36000 seen just above, which has yet to be hit. At the time of writing the buyers look to be in full force and are currently doing battle with the sellers around the highs 1.35791, if the buyers overcome this selling pressure, our first target will no doubt be hit very soon after.
Pending/P.A confirmation orders:
- Pending buy orders (Green line) are seen around demand (1.33995-1.34298) at 1.34368. This demand area will more than likely see some sort of reaction due to its location seen to the left.
- The pending buy order (Green line) set at 1.35378 just above demand at 1.35036-1.35312 is now active. Traders should keep a close eye on the first target area seen above at 1.36000 (as seen below).
- No P.A confirmation buy orders (Red line) are seen in the current market environment.
- Pending sell orders (Green line) seen at 1.36955 just below supply at 1.37235-1.37005 are set here since this level remains untouched, meaning unfilled orders are likely still set around this area.
- P.A confirmation sell orders (Red line) are visible below the minor resistance 1.36666 at 1.36625, this level has proved valid in the past, but still needs to be confirmed due to a spike/wick (circled) seen above resistance, which may have consumed most of the sellers originally there. Do be on your guard with these sell orders; the higher-timeframes are currently indicating that higher prices may be seen this week (Weekly demand: 1.34770-1.36771 Daily demand: 1.34770-1.35557).
- Areas to watch for buy orders: P.O: 1.34368 (SL: 1.33926 TP: Dependent on how price action approaches the zone) 1.35378 (Active) (SL: 1.34971 TP: [1] 1.36000 [2] 1.36666 [may be subject to change depending on approaching price action]). P.A.C: No P.A confirmation orders seen in the current market environment.
- Areas to watch for sell orders: P.O: 1.36955 (SL: 1.37270 TP: [1] 1.36666 [2] 1.36000) P.A.C: 1.36625 (SL: 1.36810 TP: Dependent on where price ‘confirms’ the level).
- Most likely scenario: With the buyers currently doing battle with the sellers around the highs at 1.35791, a minor retracement south will likely be seen towards demand at 1.35036-1.35312. However, price is expected to rally north from here hitting the round number above at 1.36000, this will likely happen before a break of demand below at 1.35036-1.35312 is seen.
GBP/USD:
4hr TF.
The pound, as reported yesterday, looks a total mess with wicks and tails seen in all directions. Pro money has well and truly been very active, notice another attempt to the upside was made at the round number 1.70000 (marked with a check sign), yet the buyers were unable to trade above the last high/wick seen to the left at 1.70105. This likely indicates strong selling interest in and around this supply area/round number (1.69963-1.69726/1.70000).
Price is currently once again seen trading around minor support (1.69431), and at the time of writing the sellers are unable to positively close below. A pending sell order can only be set once an attempt to consume the majority of the buyers around the ‘mini low’ (marked with an arrow) at 1.69221 has been seen.
Pending/P.A confirmation orders:
- Pending buy orders (Green line) are seen just above the round number 1.67000 at 1.67043, this area will likely see a reaction due to the amount of credible touches this level has seen, making it an area to watch out for.
- Pending buy orders (Green line) are seen at 1.67610 just above demand at 1.67378-1.67583. A pending order is valid here due to the momentum away from the demand area, indicating orders may be left unfilled here.
- P.A confirmation buy orders (Red line) are seen just above the round number 1.68000 at 1.68038. A reaction may be likely here because of the way pro money used this level to rally prices higher with force, a quick change in direction like this likely indicates pro money activity, thus, all of their orders may have not been filled at that time. The reason a pending order is not used here is because pro money, on a regular basis perform deep stop hunts around big figure levels (1.68000), and these tails/wicks can be huge sometimes, hence the need to wait for confirmation.
- No pending sell orders (green line) are seen in the current market environment.
- The P.A confirmation sell order (Red line) set at 1.69696 just below supply at 1.69963-1.69726 still remains active. Price, however, still will need to convincingly consume buyers around the low (marked with an arrow) at 1.69221 below before a pending sell order is permitted.

- Areas to watch for buy orders: P.O: 1.67043 (SL: 1.66527 TP: [1] 1.68000 [3] 1.68708) 1.67610 (SL: 1.67345 TP: [1] 1.68000 [2] 1.69000 [likely to be changed, depending on price approach]). P.A.C: 1.68038 (SL: Dependent on approaching price action after the level has been confirmed TP: Dependent on approaching price action after the level has been confirmed).
- Areas to watch for sell orders: P.O: No pending sell orders seen in the current market environment. P.A.C: (Active-awaiting confirmation) 1.69696 (SL: More than likely will be at 1.70030 TP: Dependent on approaching price action after the level has been confirmed).
- Most likely scenario: .Price is still likely heading south from supply at 1.69963-1.69726, but we may see a lot of choppy price action before this materializes, as another test has been seen at minor support (1.69431), only this time a little deeper which may indicate accumulated selling pressure.
AUD/USD:
Daily TF.
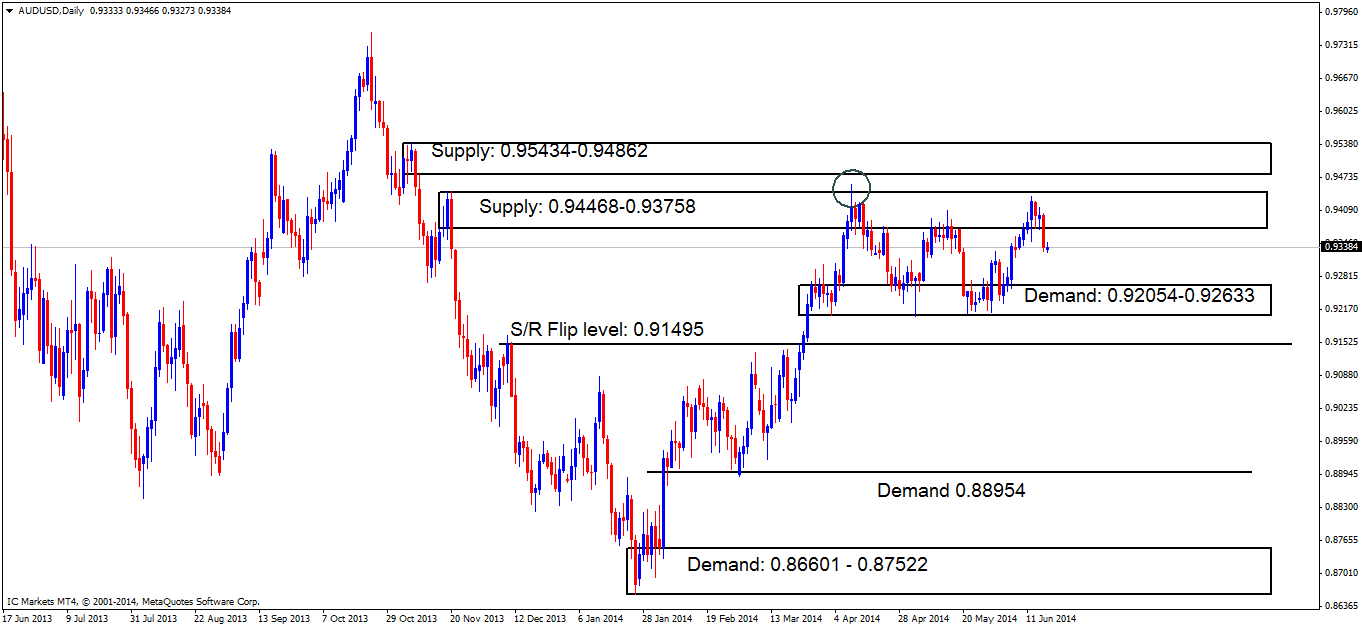
The sellers around supply at 0.94468-0.93758 have really begun shown a lot of energy recently, which was not entirely expected, as this supply area appears to have been weakened by the wick/spike (circled) that likely consumed most of the sellers in and around this area.
As per this timeframe, price is currently capped between the supply area just mentioned above, and demand below at 0.92054-0.92633.
4hr TF.
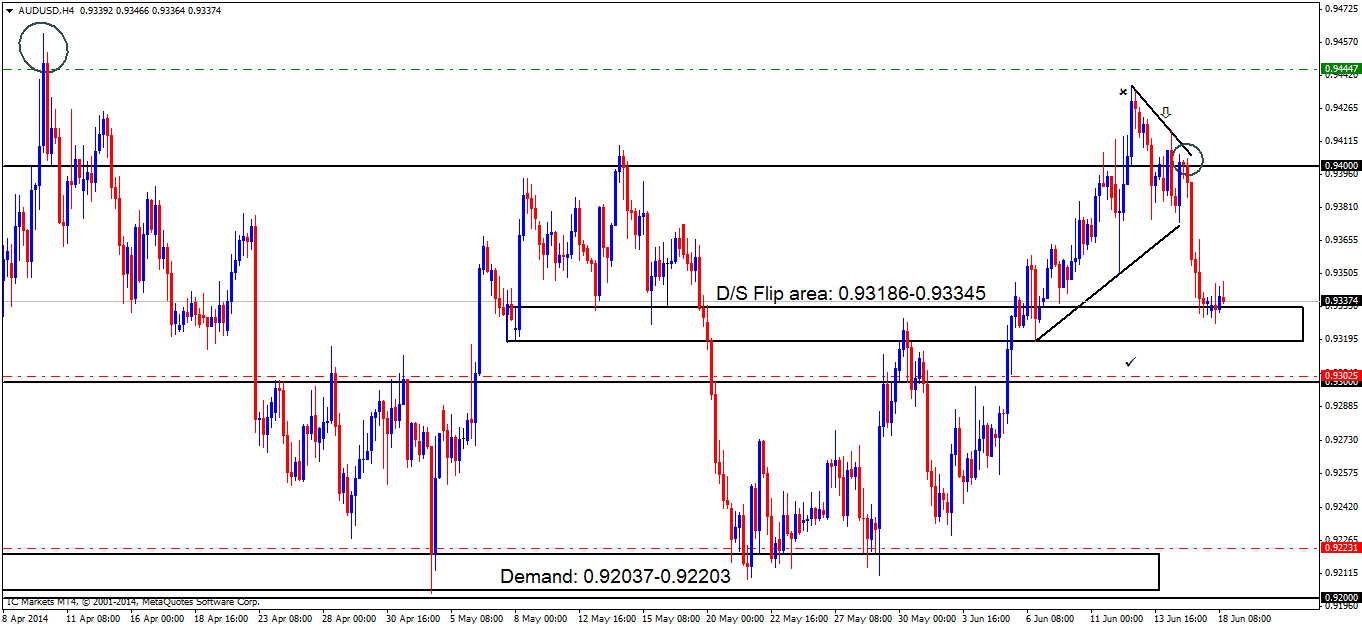
The sellers have pushed price down into the D/S flip area (demand) at 0.93186-0.93345, where buyers are currently beginning to show interest.
It was reported yesterday that the sellers have yet to push price down to its full potential, as there is more room to the downside with little stopping price from hitting the round number below at 0.93000. The zone between the D/S flip area at 0.93186-0.93345 and the round number 0.93000 marked with a check sign, appears to be a lovely area for a fakeout in the near future.
Our pending sell order above set at 0.94447 around the highs 0.94613 will still likely remain in its place for the following reasons:
- A new mini downtrend line has been attached to the chart marked with an arrow, this is not to show a trend, it is more to show how pro money has likely been consuming small supply pockets on the lower timeframes whilst price is still dropping, thus if price manages to rally, and consume the circled area (0.94000,) there will be little to stop the buyers pushing price up to the highs (marked with a circle to the left) at 0.94613 where we currently have a pending sell order set at 0.94447.
- A fakeout of the high marked with an x at 0.94375 is a great place for pro money to stop sellers out, giving them buy orders to sell into, whilst filling their pending sell orders around the highs at 0.94613.
Pending/P.A confirmation orders:
- No pending buy orders (Green line) are seen in the current market environment.
- P.A confirmation buy orders (Red line) are seen at 0.92231 just above demand at 0.92037-0.92203. It would be too risky to set a pending order around this area, since deep spikes into this demand zone have been seen (levels above) possibly consuming the majority of buyers in the process.
- P.A confirmation buy orders (Red line) are visible just above the round number 0.93000 at 0.93025. We require confirmation of this level because previous price action has warned us deep tests both north and south happen on a regular basis, hence the need to wait for confirmation rather than getting stopped out time after time through lack of patience.
- Pending sell orders (Green line) are seen at 0.94447, if price manages to get up to this level, active sellers are likely waiting because of how quickly price changed in direction, only pro money have the account size to do this, indicating unfilled sell orders may still be unfilled there.
- No P.A confirmation sell orders (Red line) are seen in the current market environment.
- Areas to watch for buy orders: P.O: No pending orders are seen with current price action. P.A.C: 0.92231 (SL: more than likely will be at 0.91984 TP: Dependent on approaching price action after the level has been confirmed) 0.93025 (SL: Dependent on approaching price action after the level has been confirmed TP: Dependent on approaching price action after the level has been confirmed).
- Areas to watch for sell orders: P.O: 0.94447 (SL: 0.94667 TP: Dependent on approaching price action). P.A.C: No P.A confirmation sell orders seen in the current market environment.
- Most likely scenario: Ideally we want price to rally from where price is currently trading to the highs seen at 0.94613, however what will likely happen is a spike below to the round number 0.93000 will be seen triggering our confirmation buy order set at 0.93025.
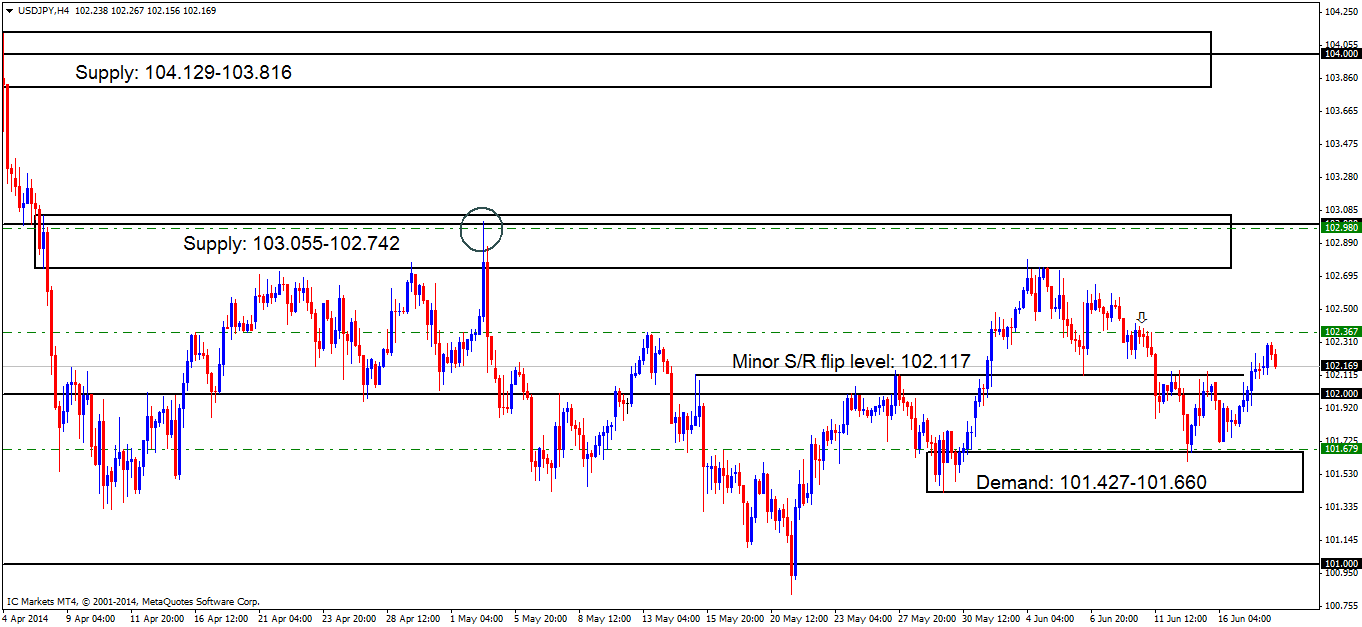
USD/JPY:
Daily TF.
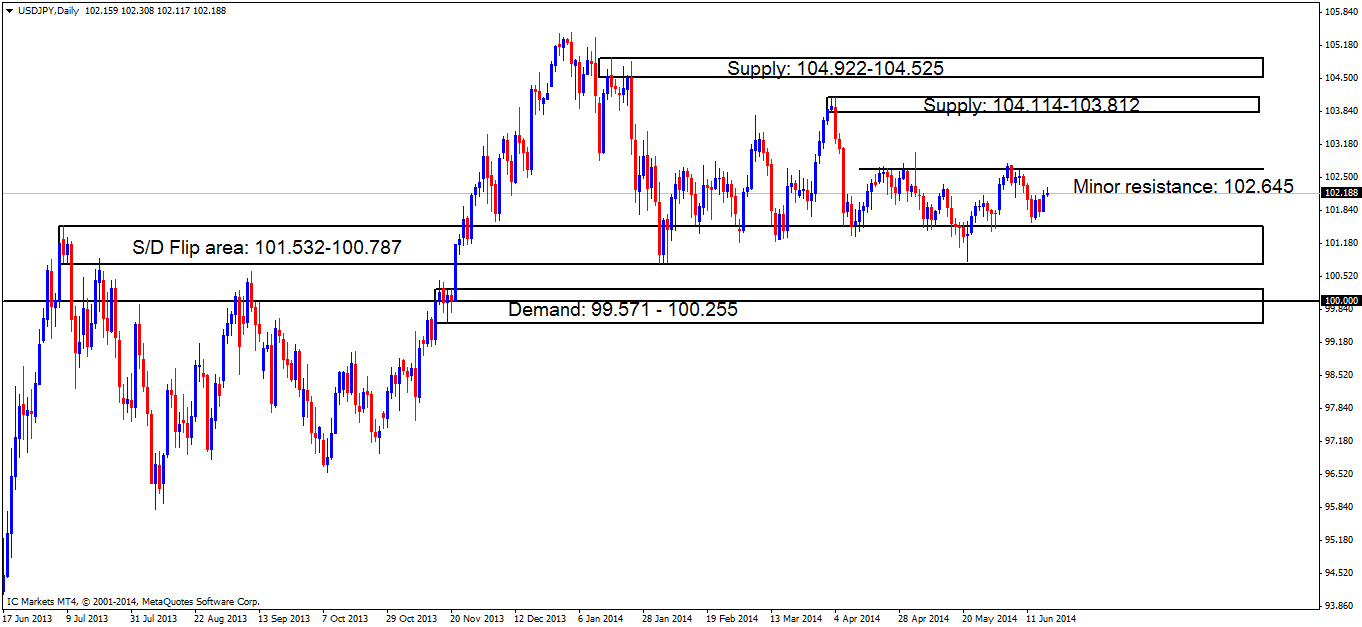
The daily timeframe currently shows price is trading between demand below at 101.532-100.787 and minor resistance (supply) above at 102.645. With the weekly timeframe showing strong long-term support around the 101.254 area, price will likely break the daily upper supply (minor resistance – level above) before breaking the daily demand area below (levels above).
4hr TF.
It was reported in the last analysis that price would likely retrace a little from hitting the minor S/R flip level at 102.117, then proceed to rally north to at least 102.367.
The sellers were clearly no match for the buyers around the S/R flip level just mentioned, as little to no retrace was seen to the downside. Buyers have made an attempt to push price up to a ‘decision point’ area seen at 102.367, which is in fact our second target for our active long trade. Sellers unfortunately begun showing interest five to six pips short of this target, so anyone who was long from 101.679 may have been inclined to close some of their position earlier nearer to the target, as there is nothing worse than a trade that nearly hits its target, then drops (in this case) right back to the entry, or worse, a loss!
Pending/P.A confirmation orders:
- The pending buy order (Green line) set just above demand (101.427-101.660) at 101.679 still remains active. The first target has been hit at 102.000; second target is seen at 102.367.
- No P.A confirmation buy orders (red line) are seen in the current market environment.
- Pending sell orders (Green line) are visible at 102.980, deep within supply (103.055-102.742), this area may well appear to be weak now, but the way price reacted at the circled area within supply indicates pro money activity, meaning sell orders may be left unfilled there, so a pending sell order is permitted.
- Near-term pending sell orders (Green line) are seen at 102.367. A pending order is valid here since this is the area where pro money made the ‘decision’ to take prices lower into demand (101.427-101.660), unfilled sell orders were likely left there in the process.
- No P.A confirmation sell orders (Red line) are seen in the current market environment.
- Areas to watch for buy orders: P.O: (Active – 1st target hit) 101.679 (SL: 101.404 TP: [1] 102.000 [2] 102.367 [but may be subject to change]) P.A.C: No P.A confirmation buy orders are seen in the current market environment.
- Areas to watch for sell orders: P.O: 102.980 (SL: 103.108 TP: 102.117, but may well change if the market sees any new developments) 102.367 (SL: 102.458 TP: Dependent on how price action approaches this area). P.A.C: No P.A confirmation sell orders are seen in the current market environment.
- Most likely scenario: Price will likely now see a decline to the minor S/R flip level at 102.117, or if the sellers have the strength, to the round number below at 102.000, before a final rally is seen to at least 102.367.
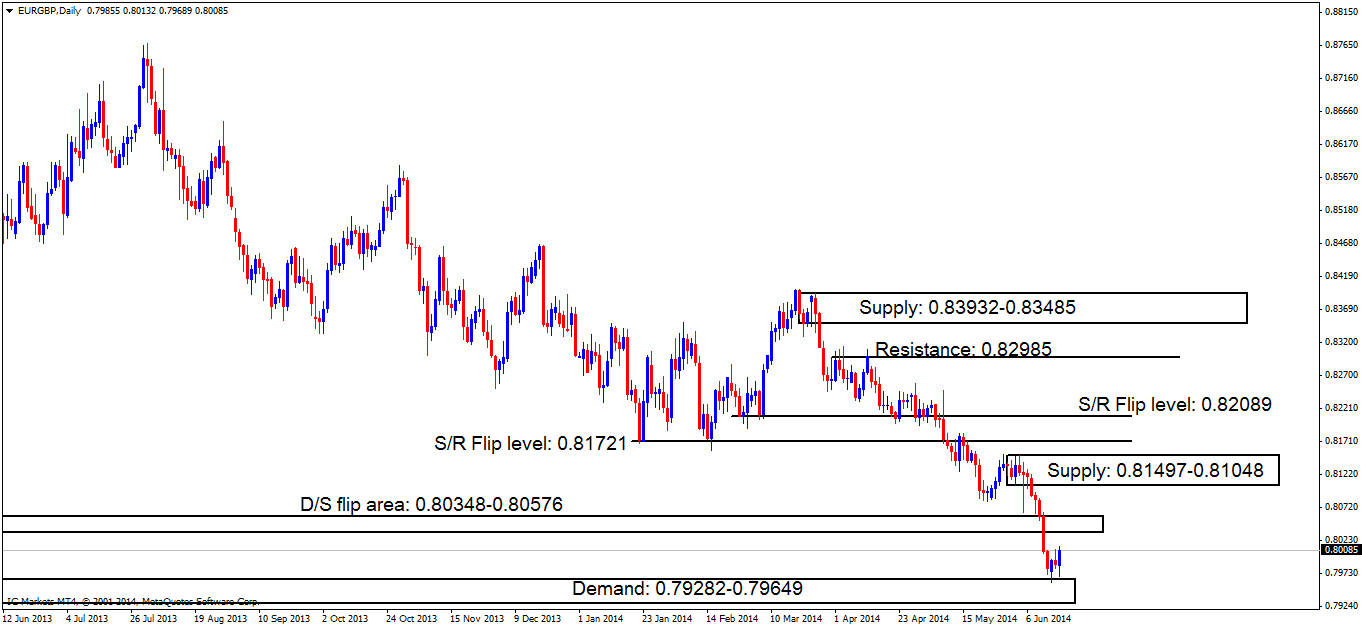
EUR/GBP:
Daily TF.
The daily timeframe shows the buyers are completely in control at the moment from demand at 0.79282-0.79649, with no opposing selling pressure seen until at least the D/S flip area at 0.80348-0.80576.
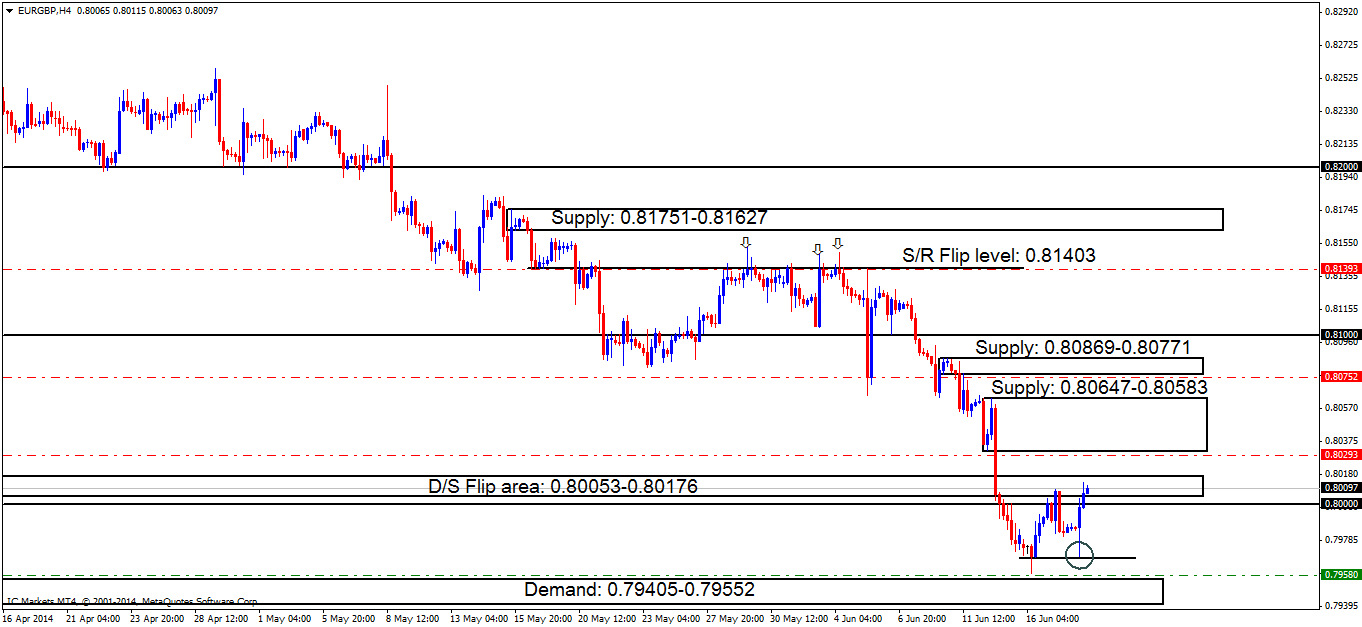
4hr TF.
Buyers appeared to have consumed the majority of sellers in and around the D/S flip area at 0.80053-0.80176, consequently, a retracement to the downside was seen as reported may happen in the last analysis.
However, price never reached our pending buy order set at 0.79580 as it was too low. Price reacted beautifully at around 0.79689 (marked with a circle), which if one looks to the near left, we can see this was an obvious ‘decision point’ (marked with the horizontal level) where pro money clearly ‘decided’ to rally price into the D/S flip area (levels above) in the first place.
All is not lost though! We do not chase price, we wait for price to come to us! Buyers are currently battling with the sellers seen deeper within the D/S flip area (levels above), if there are some big sell orders remaining there, price will likely drop down to where it reacted to before at around the 0.79689 area, but this time, as some of the buyers will have been consumed there, a spike below this level into demand at 0.79405-0.79552 may be seen, thus filling our pending buy order (level above) in the process.
Pending/P.A confirmation orders:
- No P.A confirmation buy orders (Red line) are seen in the current market environment.
- A pending buy order (Green line) has been set at 0.79580 just above demand at 0.79405-0.79552. The rationale behind this is because buyers have likely consumed the majority of the sellers lurking around supply (D/S flip area) at 0.80053-0.80176, likely clearing the path for higher prices. A small retracement will possibly be seen to collect more buyers for a rally higher, thus triggering our pending buy order.
- No pending sell orders (Green line) are seen in the current market environment.
- P.A confirmation sell orders (Red line) under the S/R flip level 0.81403 at 0.81393 is an area where a reaction is likely, however there were too many wicks north seen marked with arrows, indicating sellers are drying up, thus, the need to wait for more confirmation.
- P.A confirmation sell orders (Red line) are seen just under supply (0.80869-0.80771) at 0.80752. Confirmation orders were used here because price is trading around a weekly demand area (0.79596-0.80299), which means price could easily consume this supply level as the higher timeframes usually overrule the lower timeframes.
- P.A confirmation sell orders (Red line) are seen just below supply (0.80647-0.80583) at 0.80293. Confirmation orders were used here because price could easily consume this supply level as we are currently deep within a weekly demand area (0.79596-0.80299), which means price could easily consume this supply level as the higher timeframes usually overrule the lower timeframes.
- Areas to watch for buy orders: P.O: 0.79580 (SL: 0.79368 TP: [1] 0.80000 [2] 0.80583 [May change if any new developments in the market are seen]) P.A.C: No P.A confirmation buy orders are seen in the current market environment.
- Areas to watch for sell orders: P.O: No pending sell orders are seen in the current market environment. P.A.C: 0.81393 (SL: Will be likely set at 0.81564 TP: Will be likely set at the round number 0.81000) 0.80752 (SL: likely to be set at 0.80900 TP: Dependent on where price ‘confirms’ the level) 0.80293 (SL: likely to be set at 0.80648 TP: Dependent on where price ‘confirms’ the level).
- Most likely scenario: Price will likely decline from supply (D/S flip area) at 0.80053-0.80176 to demand seen below at 0.79405-0.79552, before any higher prices are seen.
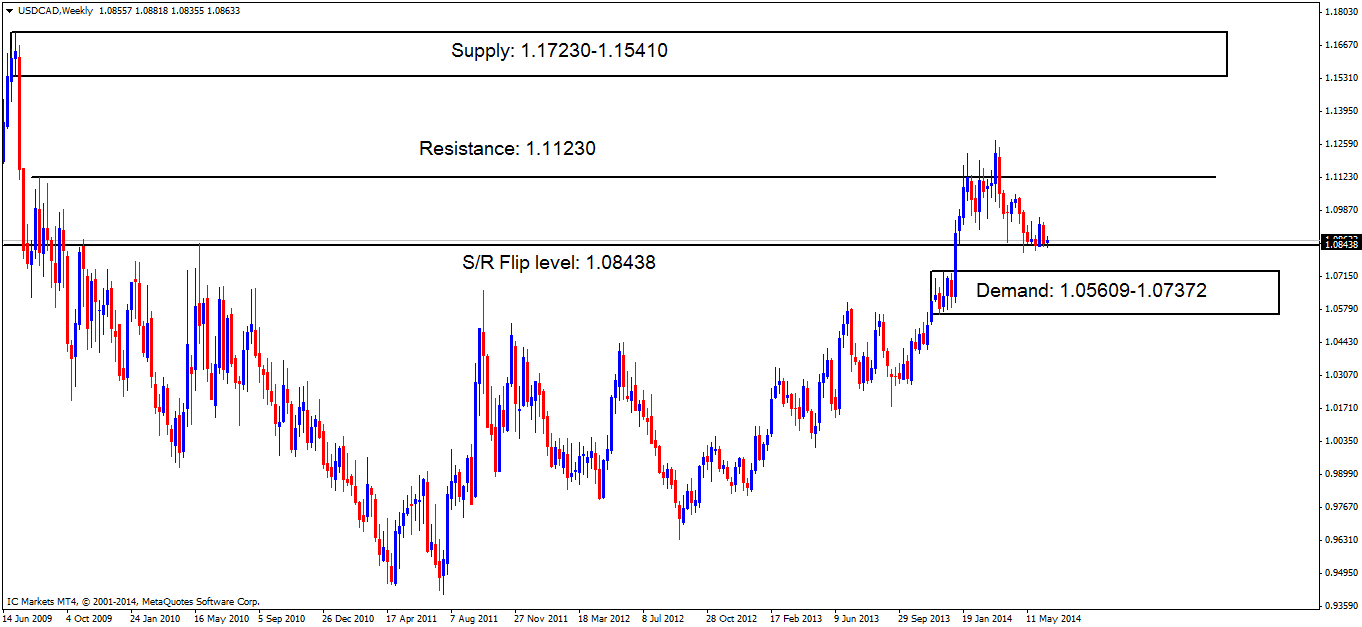
USD/CAD:
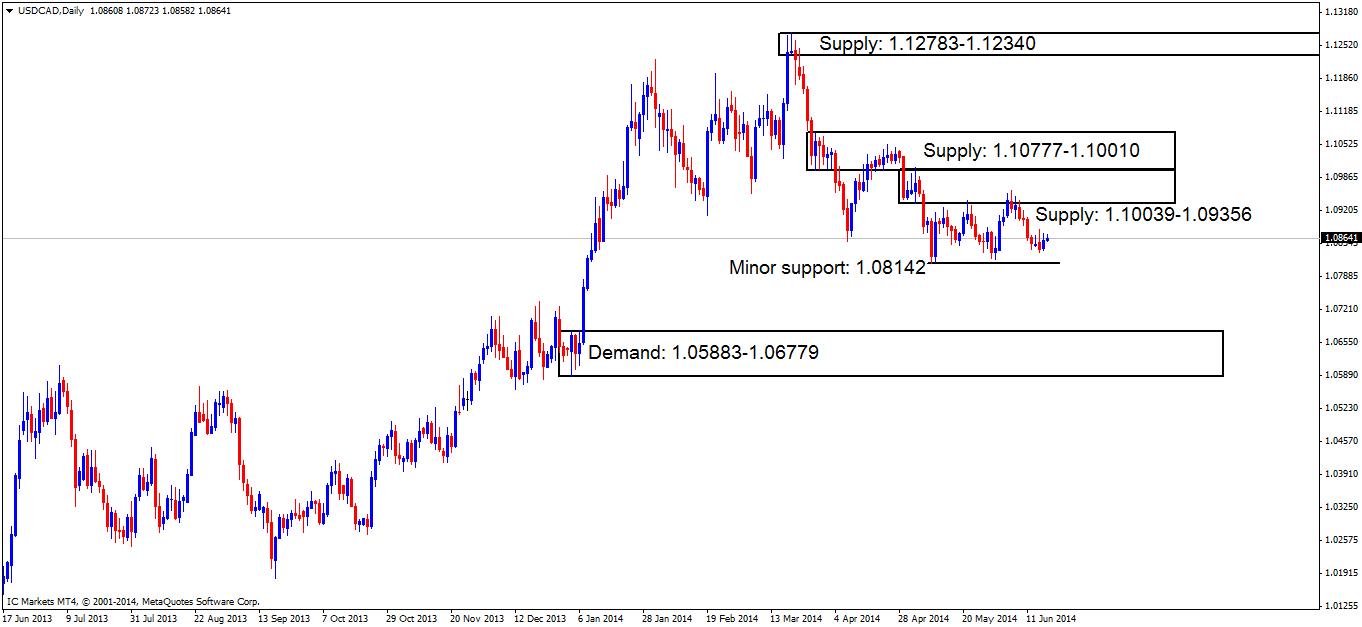
Weekly TF.
The weekly timeframe shows price is trading in and around support (S/R flip level) at 1.08438 with no sign of a break to the downside visible yet.
Daily TF.
The daily timeframe is currently showing price capped between demand below (minor support) at 1.08142 and the lower of the two stacked supply areas seen at 1.10039-1.09356 due to the weekly timeframe being seen at a major area of support (level above), as a result, we can likely expect the daily supply area just mentioned to break first before minor support at 1.08142 does.
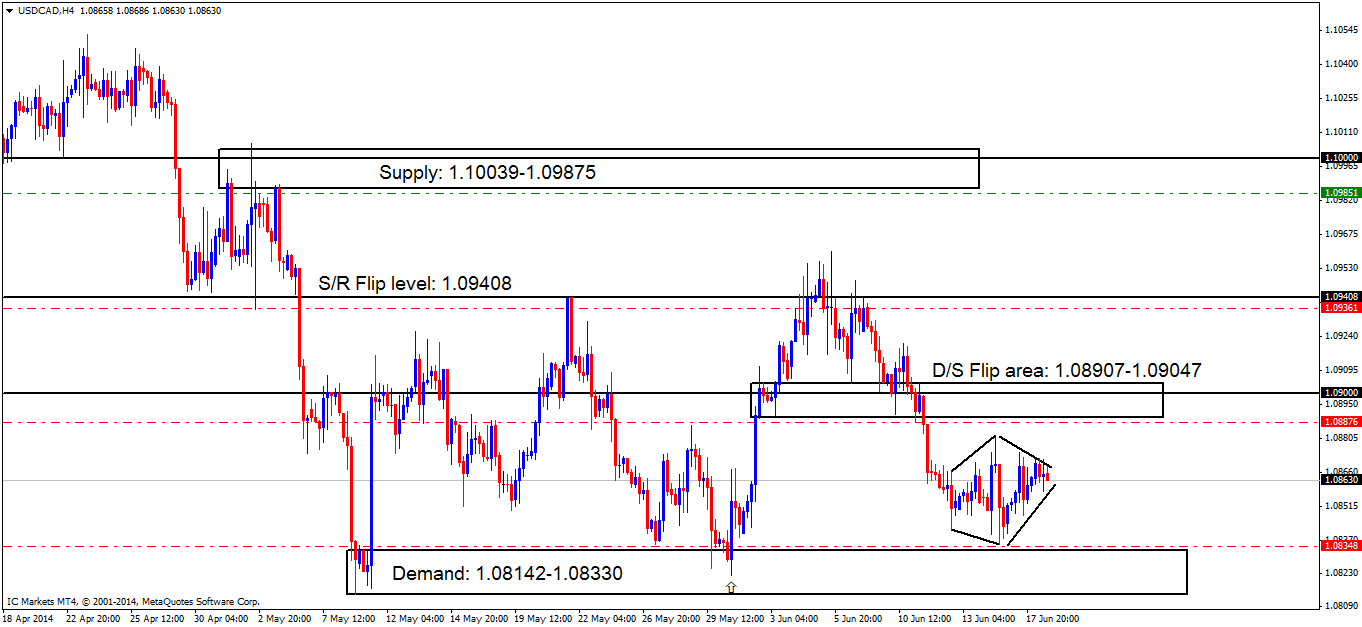
4hr TF.
The 4hr timeframe shows little development has been seen, other than a rhombus (Diamond) shape formation being formed, these patterns do occur, however they are rare and quite risky to trade as price could, theoretically trade in any direction as both minor supply and demand within the pattern have been consumed.
Price is still seen trading between supply at 1.08907-1.09047 and demand below at 1.08142-1.08330 with a break yet to materialize.
Pending/P.A confirmation orders:
- No pending buy orders (Green line) are seen in the current market environment.
- P.A confirmation buy orders (Red line) seen just above demand (1.08142-1.08330) at 1.08348. There may be orders left unfilled here, however, a pending order is not wise due to how deep price penetrated the level before (marked with an arrow).
- Pending sell orders (Green line) just below supply (1.10039-1.09875) at 1.09851 will very likely see a nice reaction. However, we should remain aware of the big figure number 1.10000 lurking within the top half of the supply area (levels above), so a bigger stop may be necessary.
- P.A confirmation sell orders (Red line) are seen just below the S/R flip level (1.09408) at 1.09361. A P.A.C order was selected here because of the deep wicks seen in and around this area, possibly indicating sellers have been consumed, thus weakening the level on return, and also not forgetting we are currently in higher – timeframe demand (weekly:1.08438 daily: 1.08142).
- P.A confirmation sell orders (Red line) are seen just below the D/S flip area (1.08907-1.09047) at 1.08876. Pending orders are not logical here since price could very well spike north, deep into the zone, attempting to penetrate the round number 1.09000 which could possibly stop us out if we had pending orders set, and also not forgetting we are currently in higher –timeframe demand (weekly:1.08438 daily: 1.08142).
- Areas to watch for buy orders: P.O: There are no pending buy orders seen in the current market environment. P.A.C: 1.08348 (SL: Likely to be set at 1.08127 TP: Dependent on approaching price action after the level has been confirmed).
- Areas to watch for sell orders: P.O: 1.09851 (SL: 1.10114 TP: [1] 1.09408 [2] 1.09047) P.A.C: 1.09361 (SL likely to be set at 1.09513 TP: Dependent on approaching price action after the level has been confirmed) 0.08876 (SL: Dependent on approaching price action after the level has been confirmed TP: Dependent on approaching price action after the level has been confirmed).
- Most likely scenario: Current price action has presently formed a diamond shape formation. Now, if we look closely enough, we can see all supply and demand within the pattern have been consumed, thus a likely scenario is very difficult to give at the time of writing. On the safe side, price will likely remain trading within supply seen above at 1.08907-1.09047 and demand below at 1.08142-1.08330 possibly testing either side
USD/CHF:
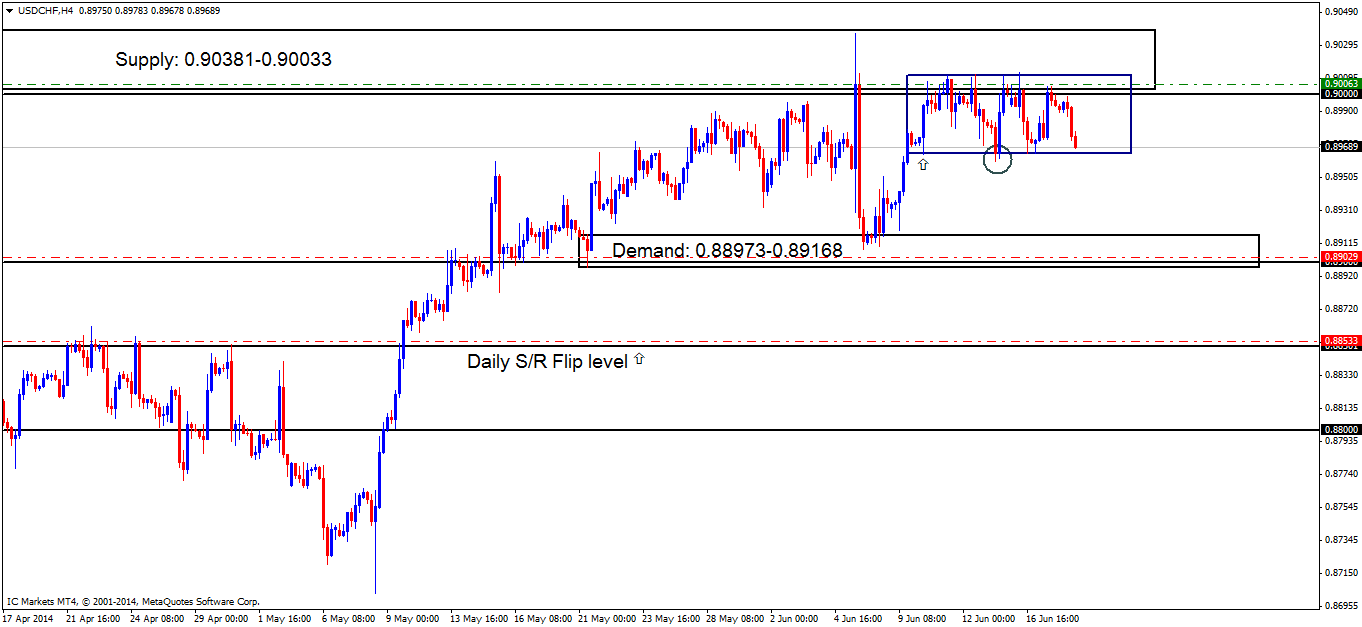
4hr TF.
The mini range seen at 0.90116/0.89643 still remains firmly in place. The sellers have recently been seen dominating the market, with price currently testing the lower limit of this range (0.89643).
A break to the downside will likely be seen very soon, as once the buyers around lower limit of the range (level above) have been totally consumed, there will be little stopping price from dropping down to demand seen at 0.88973-0.89168.
As mentioned yesterday, we still have an active sell order in the market from 0.90063 with our first target down below at 0.89168, as we remain confident lower prices are expected soon.
Pending/P.A confirmation orders:
- No pending buy orders (Green line) are seen in the current market environment.
- P.A confirmation buy orders (Red line) are seen just above the daily S/R flip level (0.88501) at 0.88533. This level needs to see some confirming price action before any entry is placed in the market, due to their being no logical area for a stop loss order.
- Near-term P.A confirmation buy orders (Red line) are seen within demand (0.88973-0.89168) at 0.89029, just above the round number 0.89000, as price may retrace to demand to collect unfilled orders.
- The pending sell order (Green line) visible at the base of supply (0.90381-0.90033) just above the round number 0.90000 at 0.90063 still remains active, so keep a close eye on the first target area.
- No P.A confirmation sell orders (Red line) are seen in the current market environment.
- Areas to watch for buy orders: P.O: There are no pending buy orders seen in the current market environment. P.A.C: 0.88533 (SL: Dependent on approaching price action after the level has been confirmed TP: Dependent on approaching price action after the level has been confirmed) 0.89029 (SL: likely to be set at 0.88784 TP: Dependent on approaching price action after the level has been confirmed).
- Areas to watch for sell orders: P.O: (Active) 0.90063 (SL: 0.90412 TP: [1] 0.89168 [2] 0.88501) P.A.C: There are currently no P.A confirmation orders seen in the current market environment.
- Most likely scenario: Price will likely see more selling to the downside today with a break being seen of the lower limit of the range (0.89643). Once a break to the downside is visible, look for more selling opportunities on the retest of where price broke out around the 0.89643 area.
XAU/USD (GOLD)
Daily TF.
The daily timeframe shows price is currently capped between supply above at 1295.52-1285.52 and demand below at 1238.51-1254.97.
A break above supply (levels above) could force price to test oncoming supply at 1331.13-1318.24, conversely, a break below demand (levels below) could force price to test oncoming demand (support) at 1182.01.

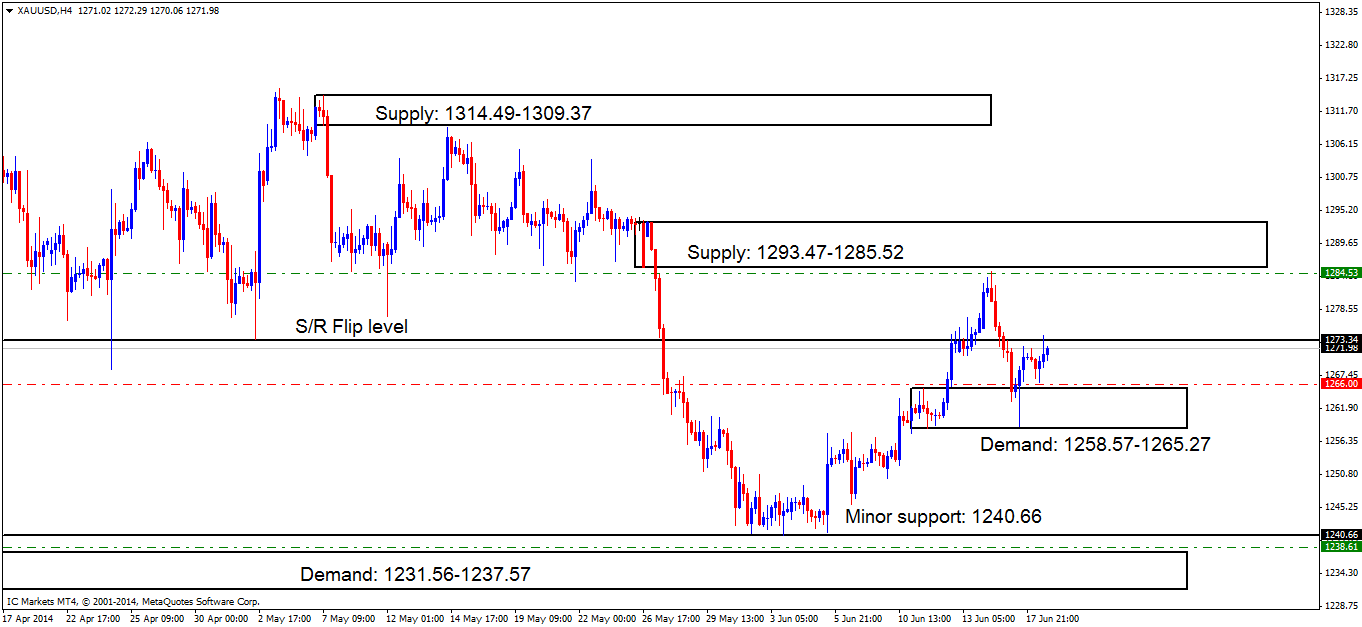
4hr TF.
Price is currently capped between supply above at 1293.47-1285.52 and demand below at 1258.57-1265.27. A break of either side is possible at the moment as the higher timeframes are not showing much in the way of direction (see above).
Demand at 1258.57-1265.27 clearly had active buyers within this area. Sellers are currently being seen showing interest around the S/R flip level resistance at 1273.34, a positive close above this level would not be good for our live sell order at 1284.53, but would be good for our confirmation buy order set at 1266.00.
- Pending buy orders (Green line) are seen above demand (1231.56-1237.57) at 1238.61 as pro money will in the future likely fake the minor support level at 1240.66 into demand below (levels above).
- The P.A confirmation buy order (Red line) set just above demand (1258.57-1265.27) at 1266.00 is now active. For this level to be confirmed, buyers will need to consume the majority of the sellers around supply above at 1293.47-1285.52, a pending buy order can then be set at around the 1266.00 area awaiting a possible retracement.
- The pending sell order (Green line) set just below supply (1293.47-1285.52) at 1284.53 remains active with price hitting its second target at 1266.00. Third and final target is seen below at 1240.66.
- No P.A confirmation sell orders (Red line) are seen in the current market environment.
- Areas to watch for buy orders: P.O: 1238.61 (SL: 1230.64 TP: Dependent on approaching price action) P.A.C: 1266.00 (Active-awaiting confirmation) (SL: likely to be set at 1257.31 TP: Dependent on approaching price action after the level has been confirmed).
- Areas to watch for sell orders: P.O: 1284.53 (Active-2nd target hit) (SL: 1294.70 TP: [1] 1273.34 [2] 1266.00 [3] 1240.66) P.A.C: There are currently no P.A confirmation sell orders seen in the current market environment.
- Most likely scenario: Price will likely trade between the S/R flip level resistance at 1273.34 and demand below at 1258.57-1265.27 during the lower-volume sessions, once volatility picks up, a break either side may be seen, so be on your guard, and only trade when price breaks out and retests one of these areas (levels above).
Source: Thursday 19th June: Daily technical outlook and review.


