Previous Story
Thursday 23rd April: Daily technical outlook and review

EUR/USD:
Monthly view: From this timeframe, we can see that the Euro has been in a nose dive since 01/05/2014.Presently however, we’re seeing price tackle a long-term monthly swap level at 1.0640, which as you can see, also boasts long-term trendline convergence (green line) from the low 0.8230 (02/10/2000).
Weekly view: The weekly scale reveals that supportive pressure is coming in from a weekly demand area at 1.0333-1.0502, positioned just below the aforementioned long-term monthly swap level.
Daily view: Price appears to be hesitating in no-man’s-land between a daily resistance zone at 1.1051-1.0918 and a daily demand area at 1.0461-1.0565, which, if you look back to the weekly chart, you’ll notice that this area was in fact a prior reaction to the aforementioned weekly demand zone.
4hr view: During the course of yesterday’s sessions the Euro aggressively rallied up to the 1.0800 handle. Active shorts here had no intention of letting prices go any higher, thus a sell off was seen back down to Yesterday’s open at 1.0717, which has so far held firm.
Round numbers 1.0700 and 1.0800 are the two levels we have on our watchlist today. However, we would not feel comfortable placing pending orders at these numbers. The reason for why is simply because directly above and below these two levels are near-term structural 4hr support and resistance. Take a look above 1.0800, check out the 1.0816 4hr Quasimodo level. This hurdle could tempt a fakeout above 1.0800 today should price reach this high. As such, traders who like to place very tight stops could get caught on the wrong side here. Likewise, below 1.0700, there’s a near-term 4hr demand area coming in at 1.0658-1.0681, which could also be a lovely area to support a fake below 1.0700. Therefore, waiting for lower timeframe confirming price action is strongly recommended at both levels.
Current buy/sell orders:
- Buy orders: 1.0700 [Tentative – confirmation required] (Predicative stop-loss orders seen at: dependent on where one confirms this level).
- Sell orders: 1.0800 [Tentative-confirmation required] (Predicative stop-loss orders seen at: dependent on where one confirms this level).
GBP/USD:
Monthly view: The monthly chart shows we’ve been trending south since hitting the monthly swap level at 1.7134. Current price action shows that the bulls are beginning make a stand from just above a monthly demand area coming in at 1.4225-1.4541. Quite frankly though, until we see a break above the monthly supply area at 1.5551-1.5096, our long-term bearish bias will remain unchanged.
Weekly view: For the past five weeks, price has been teasing the underside of a weekly swap level coming in at 1.4989. However, we can see that the pound is beginning to peek above this level now – higher prices, anyone?
Daily view: From this angle, we can see price strongly closed above the aforementioned weekly swap level yesterday. As long as the buyers can defend this level we see very little stopping a rally, as the wick seen to the left marked with a green arrow at 1.5164 resembles supply consumption to us.
4hr view: The latest coming in from the 4hr pit shows price has firmly closed above 1.5000. This is fantastic; it appears we now have possible direction!
What we mean by direction is simply this. From the daily scale, we can see price has closed above a weekly swap level (see above). A move like this takes a lot of money which very few retail traders possess, so this was likely a move made by pro money. That – coupled with a clear break of 1.5000 on the 4hr timeframe tells us higher prices may be in store. This is all well and good knowing this, but how could we take advantage of it? Entering long now at current prices is out of the question for us, we’ve never made good breakout traders. That being the case, our main focus for today will be watching 1.5000 for a potential retest. Assuming price reaches here and we find an entry, our ultimate take-profit target will likely be placed at the 4hr Quasimodo resistance level at 1.5136. Nonetheless, take note of the monthly timeframe – we’re at supply, so any long position taken on this pair ought to be closely monitored.
Current buy/sell orders:
- Buy orders: 1.5000 [Tentative – confirmation required] (Predicative stop-loss orders seen at: dependent on where one confirms this level).
- Sell orders: Flat (Predicative stop-loss orders seen at: N/A).
AUD/USD:
Monthly view: From this angle, we can see price has recently closed below a monthly swing low coming in at 0.7699. This move may have cleared the path south down towards a monthly swap level seen at 0.7150.
Weekly view: For the past three months or so, the weekly timeframe shows that the buyers and sellers have been battling for position around a weekly demand area seen at 0.7449-0.7678.
Daily view: Price action on the daily scale saw follow-through buying from the mid-range daily swap level at 0.7691 yesterday. In the event that the buyers can maintain a position above this barrier, there’s a chance we may see prices challenge the upper range boundary seen at 0.7875.
4hr view: During the course of yesterday’s sessions, the AUD/USD pair aggressively rallied from the 0.7700 region. This move consequently forced prices to test the 0.7800 barrier, which, as you can see, was clearly enough to force prices south and take out a minor 4hr swap level at 0.7752-0.7744. The break below this area may be of interest to short-term breakout traders, since this move has potentially opened up the gates for further selling down to at least 4hr demand coming in at 0.7703-0.7719.
Nevertheless, In the event that this push below the 4hr swap level was a fakeout, and we see price snap back forming a pin-bar style candle, intraday longs (with lower timeframe confirmation) could be possible from this zone up to 0.7800. Other than this, there is not much else that catches our eye at this point in time; intraday-based trading seems to be the order of the day…

Current buy/sell orders:
- Buy orders: 0.7752-0.7744 region [Tentative – confirmation required] (Predicative stop-loss orders seen at: dependent on where one confirms this level).
- Sell orders: Flat (Predicative stop-loss orders seen at: N/A).
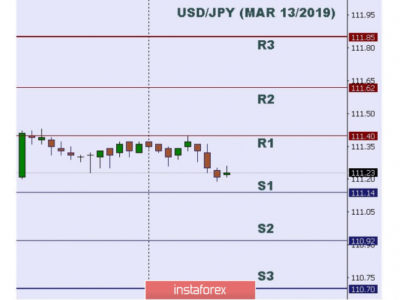
USD/JPY:
Monthly view: The trend direction on the monthly timeframe is clear. Nonetheless, the past few months has seen momentum severely diminish as selling interest appears to be entering the market around monthly supply at 124.13-120.76.
Weekly view: For the past month or so, the buyers and sellers have been seen pulling for position within a weekly demand area coming in at 118.22-119.40.
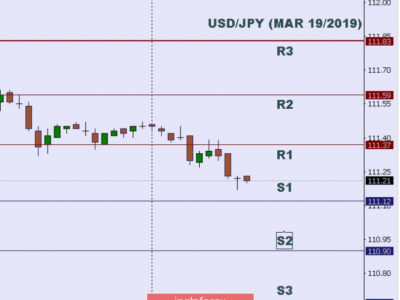
Daily view: The daily scale shows that this pair posted further gains yesterday as price advanced to a fresh high of 119.95. Further upside at this point will likely see prices collide with a daily Quasimodo resistance level at 120.35.
4hr view: The recent buying interest on this pair has, as you can see, forced price to clash with the 119.96 level. This number has already seen a small reaction, but quite honestly, we were expecting more volatility.
Given the points made above, today’s spotlight will be firmly focused on the 119.96 number. If selling pressure manages to hold the market below this level, we’ll begin looking for confirmed short trades. Prospective take-profit targets come in at the minor 4hr swap level 119.69, and the 4hr demand area seen just below it at 119.33-119.44. By shorting this level, however, you’d effectively have monthly supply backing this trade, but at the same time, you’d be colliding with the prevailing trend and buying opposition from weekly demand (see above), so play safe
On the flip side, a close above 119.96 would likely open the window for prices to challenge 4hr supply at 120.83-120.48 (located just above the aforementioned daily Quasimodo resistance level). The reason we believe price could rally this far is simply because to the left, there is very little active supply. Take note of the supply consumption wicks seen marked with black arrows at 120.41 and 120.11. That being said, we have no plan to buy any breakout above 119.96. A clear retest and lower timeframe confirmation will need to be seen beforehand. Considering longs above 119.96 would put you in the direct firing line of monthly supply, so carefully monitoring any trade above this number is highly recommended.

Current buy/sell orders:
- Buy orders: Flat (Predicative stop-loss orders seen at: N/A).
- Sell orders: 119.96 [Tentative – confirmation required] (Predicative stop-loss orders seen at: dependent on where one confirms this level).
USD/CAD:
Monthly view: The upward trend seems to be losing steam after hitting a monthly supply zone coming in at 1.3063-1.2597. In the event that prices continue to fall from here, we see very little monthly support until price reaches 1.1752.
Weekly view: From this angle we can actually see that price reacted beautifully to a weekly Quasimodo resistance level at 1.2765 (positioned relatively deep within the aforementioned monthly supply area). Weekly support is not expected to come into the market until around the 1.1814 point.
Daily view: As you can see, price recently rebounded from a daily swap level at 1.2083, and has begun to consolidate. Assuming that the buyers make a stand today, the most we see prices rallying to is the 1.2386 daily swap level.
4hr view: Yesterday’s sessions saw the Loonie pair sell off, which consequently drove prices into minor 4hr support coming in at 1.2217. Even though the monthly and weekly timeframes are suggesting further selling, we cannot ignore how 4hr price action is behaving. Check out the recent 4hr inverted pin-bar candle (1.2268-1.2226). On its own does not mean much to us, but when we’re at support and it has stabbed local 4hr supply above at 1.2286-1.2266, which saw very little bearish follow-through, this may suggest the bears are out of steam and it’s time for the bulls to take charge. Taking longs from this 4hr support level would need (for us anyway) lower timeframe confirming price action, since a fakeout below to 1.2200 could well be on the cards before a move higher is seen. With regards to targets, keeping them close and easy to reach is the best path to take since let’s not forget where price is located on the monthly scale (see above).

Current buy/sell orders:
- Buy orders: 1.2217 [Tentative – confirmation required] (Predicative stop-loss orders seen at: dependent on where one confirms this level).
- Sell orders: Flat (Predicative stop-loss orders seen at: N/A).
USD/CHF:
Monthly view: The USD/CHF pair is currently tackling the underside of a long-term monthly swap level at 0.9848, which, as you can probably see, also converges just beautifully with a major trendline extended from the high 1.3230.
Weekly view: For about a month now, weekly support has been forming around the 0.9512 region. This market clearly likes this level at the moment.
Daily view: From this angle, it is clear a consolidation zone is currently being chiseled out above the aforementioned weekly support level. Upper limits are seen in the form of a daily supply area at 0.9904-0.9771; the lower limits represent a daily demand zone coming in at 0.9449-0.9545. The recent buying has placed current action just below the upper limits, so for anyone presently long this pair may want to take note of this.
4hr view: The U.S Dollar really took the Swiss Franc for a ride yesterday. The pair rocketed 200 pips from 0.9500, and has at the time of writing, just closed above 0.9700. Assuming that the buyers can hold the market above this hurdle today, we’ll then begin watching for price to retest this level as support, as it’s very likely further upside will continue to at least 4hr supply at 0.9770-0.9742 (located just below the upper limit of the current daily range – 0.9904-0.9771).
With clear buying being seen from weekly support at the moment and room for prices to move north on both the daily and 4hr timeframes (see above for levels), an intraday push higher is very likely in our opinion. The only drawback we see is the monthly scale which shows price currently tackling resistance. This, however, should not cause us too many problems since we’re only looking for a quick 40-pip move here. Nonetheless, waiting for prices to confirm strength on the 5/15 minute timeframes is something we’d highly recommend doing before risking capital here.
As a final point, should prices reach the aforementioned 4hr supply area today, we plan to exit any longs and switch our attention to shorts since at that point, we’d be looking at resistance from the monthly, daily and 4hr timeframes (see above).

Current buy/sell orders:
- Buy orders: 0.9700 [Tentative – confirmation required] (Predicative stop-loss orders seen at: dependent on where one confirms this level).
- Sell orders: 0.9770-0.9742 [Tentative – confirmation required] (Predicative stop-loss orders seen at: 0.9772).
US 30:
Monthly view: The monthly scale shows that the DOW has been confined to a relatively steep ascending bull channel since early 2009.
Weekly view: Although the trend is strong on the monthly chart, weekly resistance around the 18098 region is presently holding this index lower, and has been for the past four months now!
Daily view: Since the beginning of the week, price has been tackling the underside of daily supply at 18207-18117.
4hr view: The 4hr timeframe shows price is compressing between two converging trendlines (upper extended from the high 18230, lower from the low 17556), which, as you can probably see, both have additional confluence (17817/18110)
The two aforementioned trendlines appear to be forming a long-term bullish pennant on the DOW. Trading anywhere other than the extremes of these two trendlines (marked in yellow) is considered mid-range to us. It is totally down to the trader if he/she believes further confirmation is needed within the yellow zones, the reason we choose confirmation the majority of the time is because it gives us that little bit more confidence to take a trade if we see the lower timeframes displaying strength as well.
Given that the monthly scale shows price in an incredibly strong uptrend at the moment, and both the weekly and daily charts displaying resistance (see above), either of the yellow zones could see a reaction today, as such, both have been placed on our watchlist.

Current buy/sell orders:
- Buy orders: 17817 [Tentative – confirmation required] (Predicative stop-loss orders seen at: dependent on where one confirms this level).
- Sell orders: 18110 [Tentative – confirmation required] (Predicative stop-loss orders seen at: dependent on where one confirms this level).
The post Thursday 23rd April: Daily technical outlook and review appeared first on .
Source:: Thursday 23rd April: Daily technical outlook and review