
Previous Story
Thursday 27th November: OPEC meetings held all day today – volatility should be expected (U.S Bank holiday).
Posted On 27 Nov 2014
Comment: 0
EUR/USD:
Weekly Timeframe: The weekly timeframe shows that the buyers are currently overpowering any selling opposition seen around the major combined weekly demand/Quasimodo support area (1.22403-1.24420/1.22866) at the moment. Assuming that the buyers do not lose their enthusiasm here, a test of a weekly support swap level at 1.25816 could be on the cards.
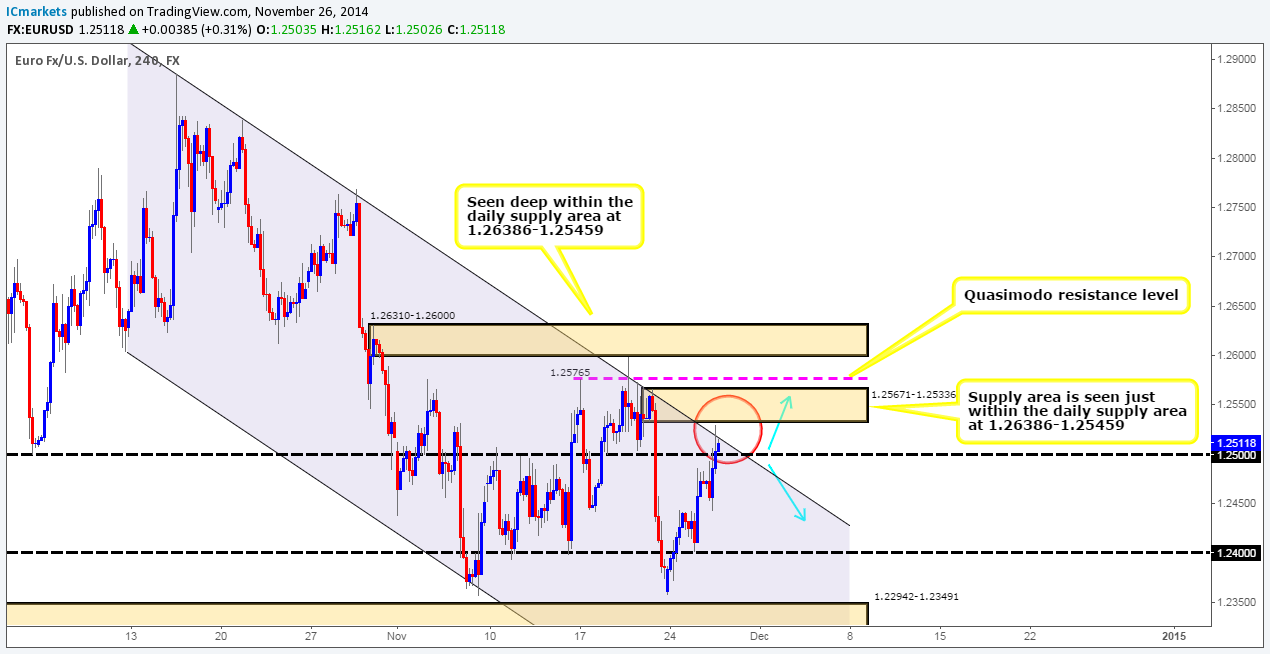
Daily Timeframe: The current situation on the daily timeframe shows that price has been, and still is consolidating between a daily supply area at 1.26386-1.25459 (surrounds the aforementioned weekly support swap level), and a long-term daily demand area coming in at 1.22877-1.23809 (located relatively deep within the aforementioned combined weekly demand/Quasimodo support area). A break above this daily range will very likely confirm buying strength from the aforementioned weekly demand/Quasimodo support area.
4hr Timeframe: The EUR/USD pair as you can see is currently trading around significant resistance – the psychological level 1.25, the 4hr supply area at 1.25671-1.25336 (located just within the daily supply area at 1.26386-1.25459) , and also the downward channel resistance (upper/lower limits: 1.28859/1.26043). This all sounds very good, but let’s not forget that price is trading out of a major combined weekly demand/Quasimodo support area (see above) at present, which in our opinion takes precedence over the aforementioned 4hr resistance cluster for the time being.
At the time of writing, we are currently watching the lower-timeframe price action within the red circle for any short-term selling opportunities that may arise, but at the same time, we are also looking for price to show buying strength, since most of our team are now favoring longs.
As of now, we see no signs that sellers have entered the market. In fact, the buyers seem to be in control for the minute, due to price successfully holding above 1.25. If a signal long comes our way around this level, we will have no hesitation in taking it. In our opinion targets for a long trade would be around the following areas: 4hr supply: 1.25671-1.25336, 4hr Quasimodo resistance level at 1.25765 and also a 4hr supply area coming in at 1.26310-1.26000. However, do bear in mind price could potentially rally much higher than the aforementioned target areas, this is why we recommended watching the lower timeframe price action to tell you when price is not likely going to continue higher, as the thing you would want to do is enter long, close your position at a near-term target, and then see price rocket north which could potentially happen here. It will be interesting to see what today’s trading brings.
Buy/sell levels:
- Buy orders: N/A (Predicative stop-loss orders seen at: N/A).
- Sell orders: N/A (Predicative stop-loss orders seen at: N/A).
GBP/USD:
Weekly Timeframe: The weekly timeframe shows that the buyers have well and truly broken above a weekly resistance flip level coming in at 1.57166. In the event that further buying is seen here, we can likely expect prices to test a weekly support swap level coming in at 1.58934.
Daily Timeframe: Similar to the weekly timeframe, the daily timeframe shows price has actually closed above the 1.57166 weekly level, and as a result has likely cleared the path north for price to test a nice-looking daily supply area seen at 1.59438-1.58338 (encapsulates the aforementioned weekly support swap level). Let’s see what we can find on the 4hr timeframe.
4hr Timeframe: The 4hr timeframe shows that price has clearly broken out north using the 1.57 level to springboard the market north up to1.58.
Shorting this market is out of the question for us at the moment, since selling into higher-timeframe buyers is something we try to avoid. With that being said, if price can close above the 4hr decision-point supply area seen at 1.58389-1.58103, a buying opportunity may present itself since the path north will likely be free up to at least 1.59.
In our opinion, a buy trade here would have to be heavily monitored, and one would need to be ready to close before the target (1.59) as active sellers will likely make an appearance around this area, simply because price would then be trading around the aforementioned weekly support swap level (see above), and also very deep within the daily supply area mentioned above at 1.59438-1.58338.
With all the above taken into consideration, we have decided to sit on our hands concerning this pair, and see how price action unfolds.
Buy/sell levels:
- Buy orders: N/A (Predicative stop-loss orders seen at: N/A).
- Sell orders: N/A (Predicative stop-loss orders seen at: N/A).
AUD/USD:
Weekly Timeframe: The weekly timeframe shows that price has been respecting the limits of a long-term down-trending channel (upper/lower limits – 0.97569/0.88468) for quite some time now. Recent trading action reveals that the sellers are attempting to break below the weekly Quasimodo support level at 0.85769, which has been holding the market higher for three consecutive weeks now. In the event that further selling is seen here, price will likely hit a major weekly demand area coming in just below at 0.80646-0.84601. Let’s see what we can find on the lower timeframes.
Daily Timeframe: The daily timeframe shows that the 0.85769 weekly level was well and truly consumed two days ago. That being said though, buying interest has begun coming into the market around 0.84789, which was not expected to be seen until price hit a fresh daily demand area seen just below at 0.83147-0.84336. Let’s take a look on the 4hr timeframe to see what we can find.
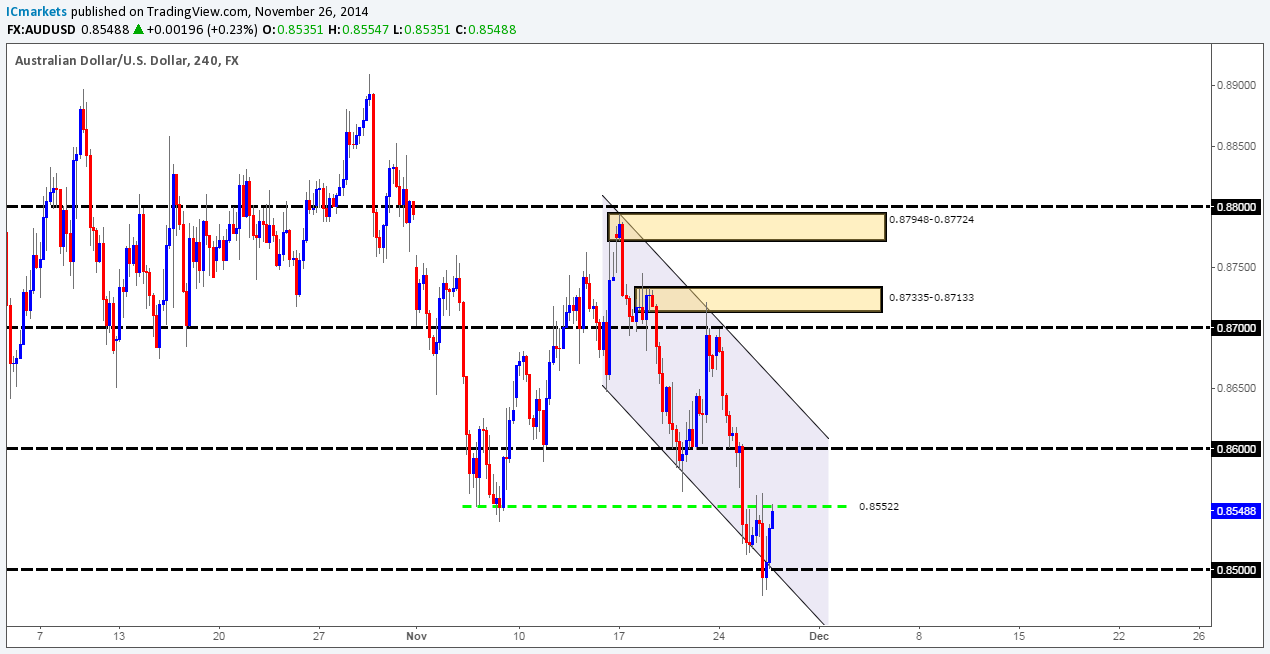
4hr Timeframe: For anyone who read our previous report, we mentioned that price will likely retest 0.85522 as resistance, and then decline down towards 0.85, which as we can all see did indeed happen. Well done to anyone who caught this move!
The 0.85 level was clearly of interest to the buyers as price has now been forced back to the 0.85522 level. Considering that price is trading ever so close to a weekly demand area (see above) at the moment, we are going to be very cautious selling this market for the time being. On the condition that the price closes above 0.85522, we could potentially retest this level as support and rally up to 0.86, where at which point we’ll be trading back around the weekly Quasimodo level mentioned above (weekly timeframe analysis) at 0.85769. On the other hand, if the sellers can hold out here, this could then fuel a sell off past 0.85 into the fresh daily demand area mentioned above at 0.83147-0.84336, which could be a fantastic area to look for buys.
Therefore, with all the above taken into consideration, we will be watching the lower-timeframes for confirmation to short at current price, but bear in mind it has to be a near-perfect signal for us to sell! Likewise, if price breaks north, we’ll consider entering long on a potential retest of 0.85522 (0.85535) targeting 0.86, but until then, we are forced to sit on our hands and be patient.
Buy/sell levels:
- Buy orders: 0.85535 [Tentative] (Predicative stop-loss orders seen at: Dependent on how the level is confirmed).
- Sell orders: Watching current price action for confirmation to short (Predicative stop-loss orders seen at: N/A).
USD/JPY:
Weekly Timeframe: Last week saw the USD/JPY pair advance to a fresh high of 118.968 as price continued on its relentless march north. This move consequently spiked above a major weekly supply area coming in at 117.931-116.799. Was this spike a fakeout to gather liquidity for lower prices, or a continuation move for a rally higher? Let’s see what we can find on the lower timeframes.
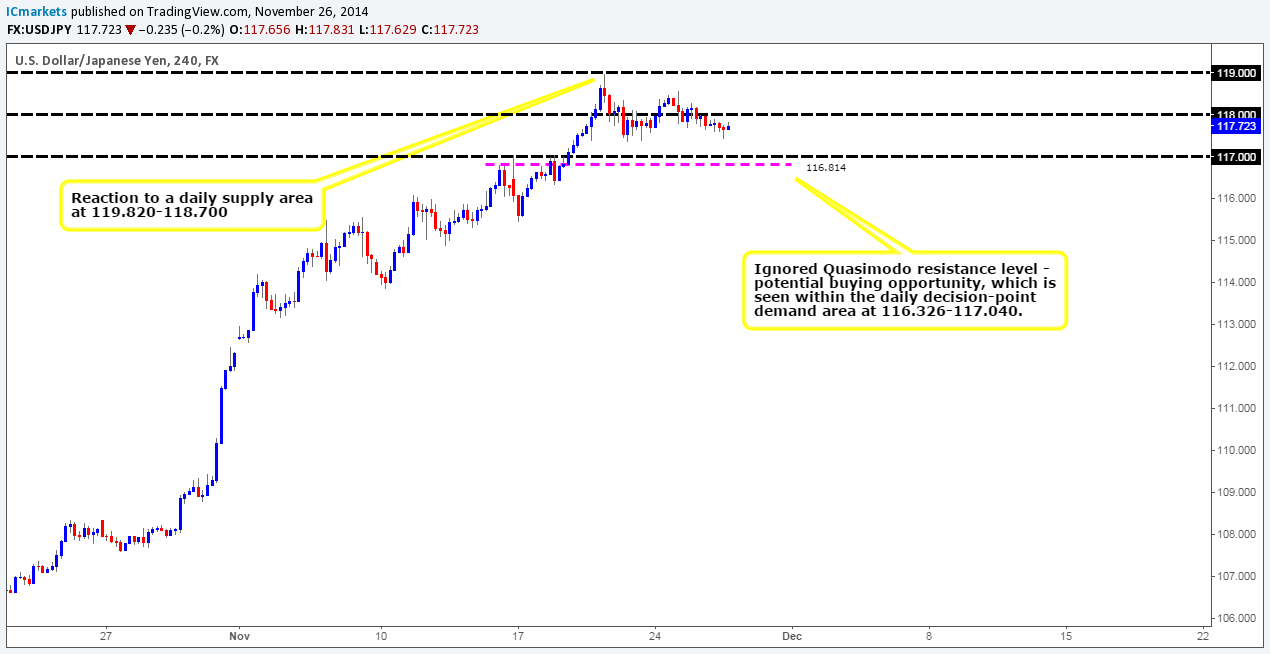
Daily timeframe: The daily timeframe still shows that this market is potentially taking a ‘breather’ from the buying onslaught seen over the past few weeks, just below a daily supply area coming in at 119.820-118.700. That being the case, for the current weekly spike to be a fakeout, follow-through selling would need to be seen from here, preferably closing below a near-term daily decision-point demand area coming in at 116.326-117.040. On the other hand, if price trades higher and consumes the daily supply area, we would know with a high probability that the market will likely continue north.
4hr Timeframe: Technically, not a lot has changed on this pair, and as such our analysis below remains the same as yesterdays.
In our opinion this pair has stagnated. One can just feel the stress being felt by the lower-timeframe traders who are attempting to buy and sell around 118 – revenge trade after revenge trade!
For us to consider buying the USD/JPY pair again, price would have to break above 119 and successfully retest it as support. Conversely, selling is something we would not be comfortable with doing until the 4hr ignored Quasimodo resistance level seen at 116.814 (located within the aforementioned daily decision-point demand area) is consumed.
Therefore, until either of the above is seen, we are unfortunately forced to sit on the side lines for the time being.
Buy/sell levels:
- Buy orders: N/A (Predicative stop-loss orders seen at: N/A).
- Sell orders: N/A (Predicative stop-loss orders seen at: N/A).
EUR/GBP:
Weekly Timeframe: The weekly timeframe shows that price has been, and still remains to be consolidating between a weekly resistance level seen at 0.80328, and a major weekly demand area coming in at 0.76931-0.78623.
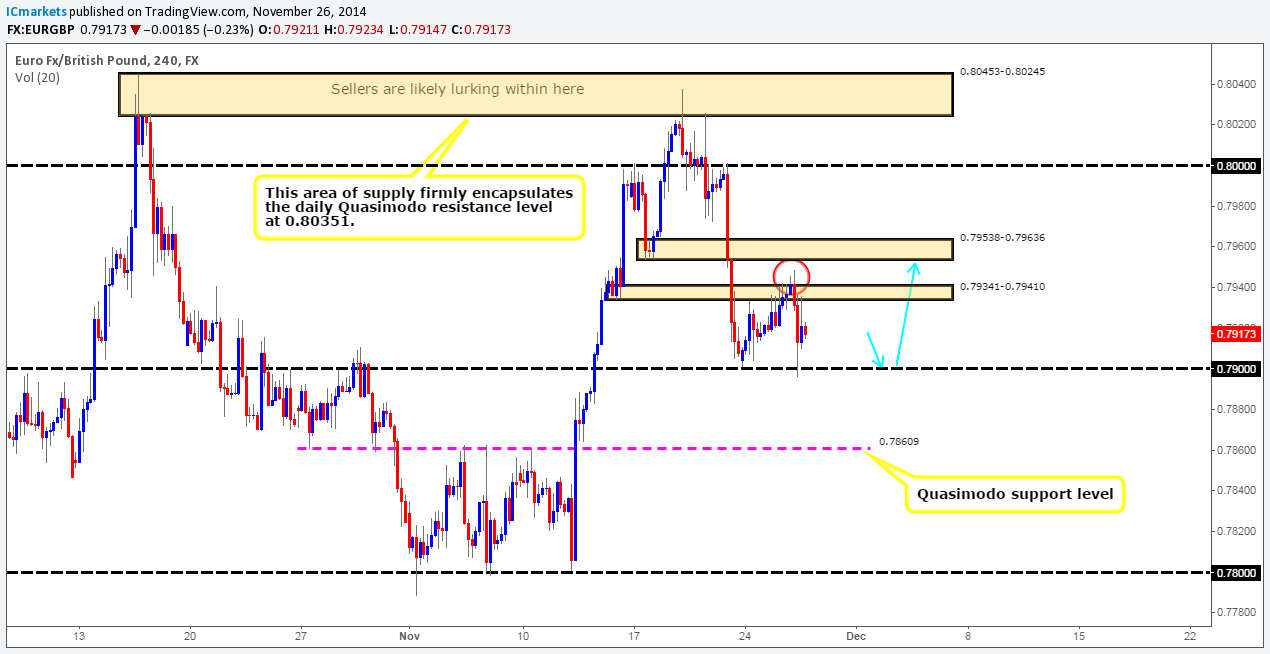
Daily Timeframe: Yesterday shows that the buyers seemed to have lost their enthusiasm as prices declined back down to the ignored daily supply area seen at 0.79109-0.78917. In the event that this area fails to hold, further selling would likely see prices hit a daily demand area coming in at 0.78007-0.78336, which is conveniently located within the weekly demand area mentioned above at 0.76931-0.78623.
4hr Timeframe: The EUR/GBP pair as you can see smashed through the 0.79217 level, which is where we had a pending buy order set (0.79243) – so this was a clear loss for us.
The momentum south forced prices down to the round-number level 0.79 where active buying is currently being seen. This level would have been ideal to take a long entry from since the path is likely clear up to at least a 4hr demand swap area coming in at 0.79538-0.79636 (sellers are likely consumed at 0.79341-0.79410 – red circle). All is not lost though; we may get a second chance to enter long if price returns to the 0.79 level and fakes below 0.78960. For the fakeout, we’ll be watching the 15-minute timeframe action since it is much easier to spot a fakeout on the lower timeframes. In normal circumstances, we would not enter on a second return, but as price is currently reacting off of an ignored daily supply area (0.79109-0.78917) at the moment, it is worth consideration.
Buy/sell levels:
- Buy orders: Will watch price action on the lower timeframes around the 0.79 level for confirmation (Predicative stop-loss orders seen at: Dependent on where the level is confirmed).
- Sell orders: N/A (Predicative stop-loss orders seen at: N/A).
USD/CAD:
Weekly Timeframe: Three weeks ago, selling interest came into the market a few pips below a major weekly supply area seen at 1.18061-1.14739, which is consequently encouraging follow-through selling. As per this timeframe, it appears the path south is potentially clear down to at least 1.09394, since we believe most of the near-term demand has already likely been consumed – check out the demand consumption tails seen at 1.11211/1.10807. Let’s see what we can find on the lower timeframes.
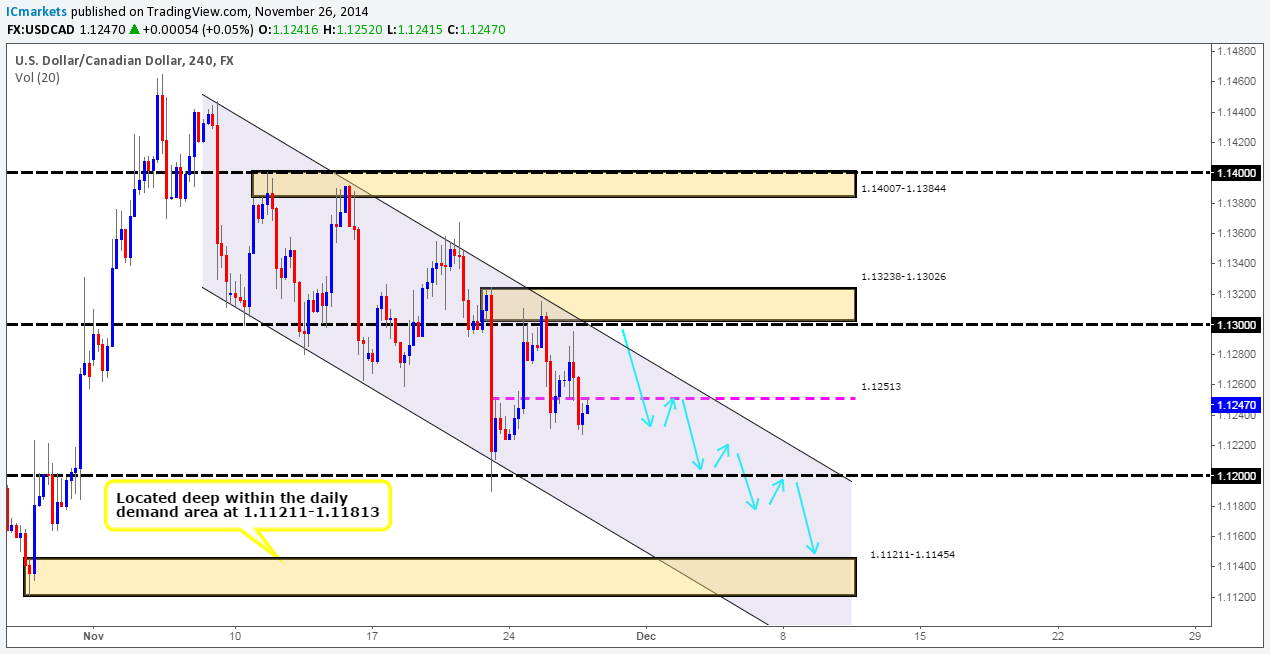
Daily Timeframe: There are clearly active sellers around the daily supply area seen at 1.13681-1.13024. Providing that the sellers retain their enthusiasm, a move south could ensue down towards a daily demand area coming in at 1.11211-1.11813. Incidentally, if the weekly-timeframe sellers do indeed want to sell down to the 1.09394 level (see above), then this daily demand area will need to be fully consumed beforehand.
4hr Timeframe: The 4hr timeframe shows that a correction was seen printing an overall high of 1.12960 before further selling ensued. We are still currently short from 1.12979 which was filled at the beginning of this week.
Price has now closed below 1.12513 for a second time, and is currently retesting this level as potential resistance. We are watching price action on the 3/5/15 minute timeframes to see if the market will signal another short allowing us to pyramid our position. Assuming that the sellers do come into the market here – regardless of whether we get an entry short or not, the next area of concern for our current sell is coming in around 1.12, where we do expect to see some buying opposition (as per the blue arrows).
With selling being seen from both the weekly and daily supply areas (1.18061-1.14739/1.13681-1.13024) at the moment, we are naturally holding out for bigger returns. Ultimately though, we’re targeting a 4hr demand area seen below at 1.11211-1.11454, which is located deep within the daily demand area mentioned above at 1.11211-1.11813.
Buy/sell levels:
- Buy orders: N/A (Predicative stop-loss orders seen at: N/A).
- Sell orders: 1.12979 [Live] (Predicative stop-loss orders seen at: 1.13276) we are also watching current price for another short entry around the 1.12513 area.


